Are you looking for a complete guide on K Means Clustering Algorithm?. If yes, then you are in the right place. Here I will discuss All details related to K Means Clustering Algorithm. So, give your few minutes to this article in order to get all the details regarding the K Means Clustering Algorithm.
Hello, & Welcome!
In this blog, I am gonna tell you-
- Clustering in Machine Learning
- Types of Clustering Algorithm in Machine Learning
- What is K Means Clustering Algorithm in Machine Learning?
- How Does K-Means Clustering Algorithm Works?
- How to Choose K Value in K Means Clustering Algorithm?
- Solved Numeric Example of K Means Clustering Algorithm
- Conclusion
- FAQ
K Means Clustering Algorithm
Before moving into K Means Clustering, You should have a brief idea about Clustering in Machine Learning.
That’s why Let’s start with Clustering and then we will move into K Means Clustering Algorithm.
Clustering in Machine Learning
Clustering is nothing but different groups. Items in one group are similar to each other. And Items in different groups are dissimilar with each other.
In Machine Learning, clustering is used to divide data items into separate clusters. Similar items are put into one cluster.
In that image, Cluster 1 contains all red items which are similar to each other. And in cluster 2 all green items are present.
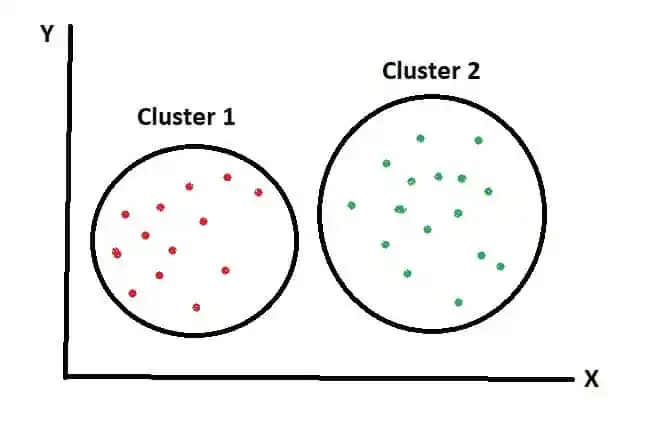
Clustering is known as Unsupervised Learning.
Now you may be wondering where clustering is used?
You can see the clustering in the Supermarket. In the supermarket, all similar items are put in one place. For example, one variety of Mangoes are put in one place, where other varieties of Mangoes are placed in another place.
Now let’s see Different Types of Clustering-
Types of Clustering Algorithm in Machine Learning
Clustering is of 3 Types-
- Exclusive Clustering.
- Overlapping Clustering.
- Hierarchical Clustering.
1. Exclusive Clustering
It is known as Hard Clustering. That means data items exclusively belong to one cluster. Two clusters are totally different from each other. As you saw in the previous image. Where Red Items are totally different from Green Items.
Example of Exclusive Clustering is K Means Clustering.
2. Overlapping Clustering
Overlapping clustering is a soft cluster. That means data items may belong to more than one cluster.
As you can see in that image, two clusters are overlapping. Because data points are not belonging to one cluster.
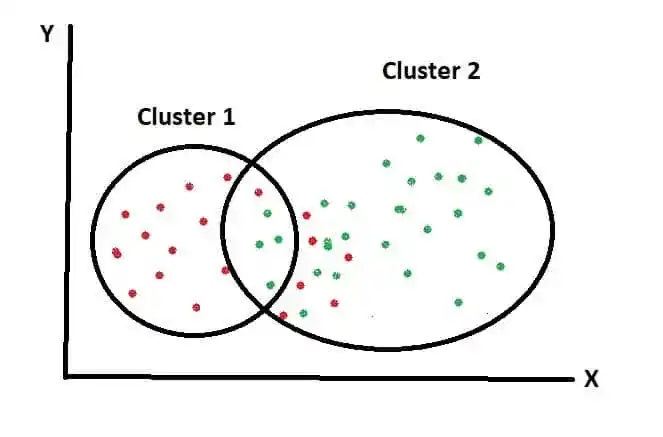
An example of Overlapping Clustering is Fuzzy or C Means Clustering.
3. Hierarchical clustering
Hierarchical Clustering groups similar objects into one cluster. The final cluster in the Hierarchical cluster combines all clusters into one cluster.
An example of Hierarchical clustering is Dendrogram.
Now you gained brief knowledge about Clustering and its types. Our main focus is K means Clustering, so let’s move into it.
What is K Means Clustering Algorithm in Machine Learning?
The objective of the K Means Clustering algorithm is to find groups or clusters in data. Here “K” represents the number of clusters.
Let’s understand K means Clustering with the help of an example-
Suppose we have two variables in our dataset. And we decided to plot those two variables on the X and Y-axis.
So after plotting on X and Y-axis, it looks something like that-
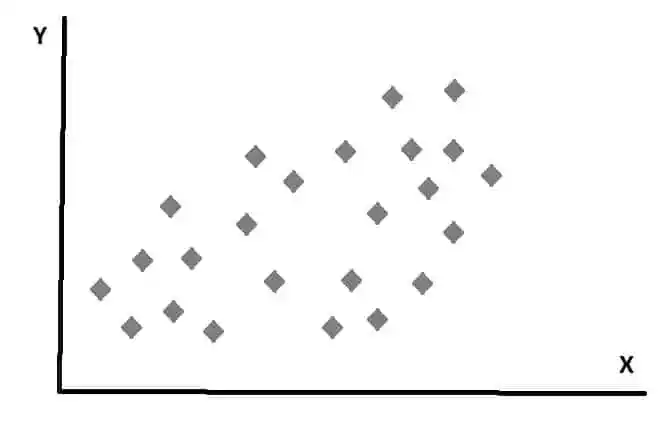
So here the question is- can we identify certain groups among all data points?.
And do we identify the number of groups?
The answer is with the help of the K Means Clustering Algorithm.
K Means Clustering Algorithms allows us to easily identify those clusters or groups. After using K means clustering, we can classify our data points into different clusters. K means clustering separate data points into two different clusters. Look something like that-
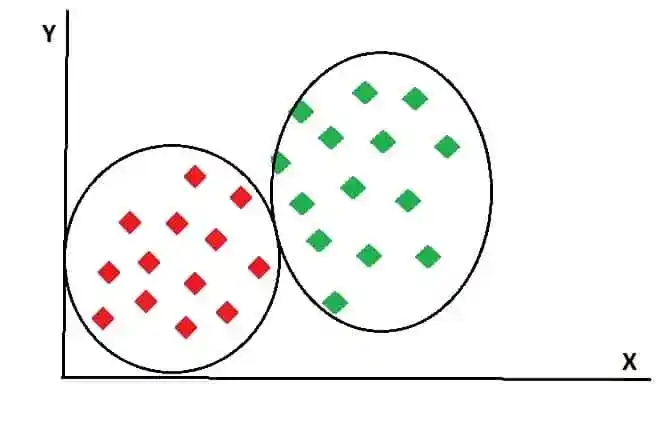
So, how K Means Clustering separate data points into different clusters?
Let’s see in the next section-
How Does K-Means Clustering Algorithm Works?
Suppose, we have some data points. Something like that-
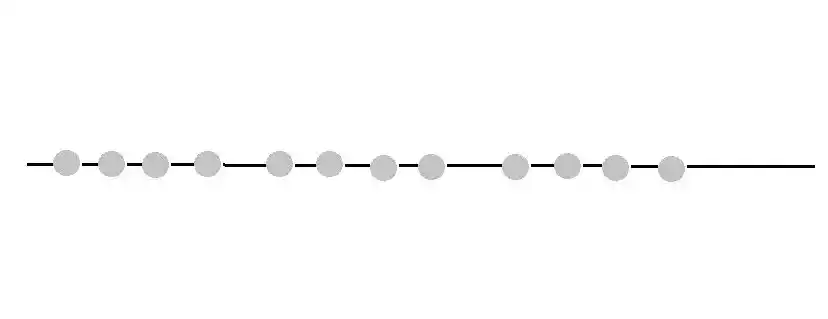
And our task is to separate these data points into 3 different clusters. Which look something like that-
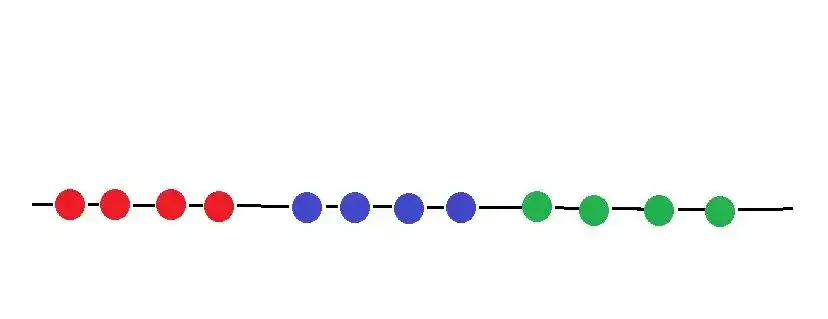
I will explain the whole working of K Means Clustering in the Step by Step manner.
So, Are you Excited?
Yes.
Let’s start-
Step 1
We start with this dataset, where we don’t have any idea about which item belongs to which clusters.
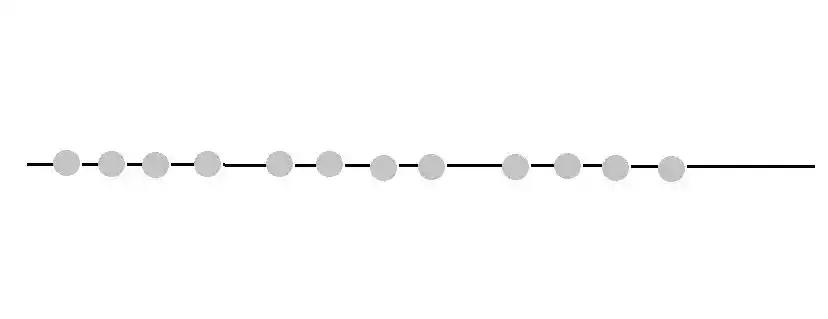
The first step in K means clustering is to choose the number of Clusters. That is K.
Now you may be wondering How to Choose the optimal K value?
So, don’t worry. I will discuss How to choose the K value later in the next section.
For now, let’s imagine we choose the number of clusters as 3.
So, k=3.
Step 2
The next step is randomly select 3 distinct data items. These data items are centroids of each cluster.
Suppose we have chosen these 3 data items.
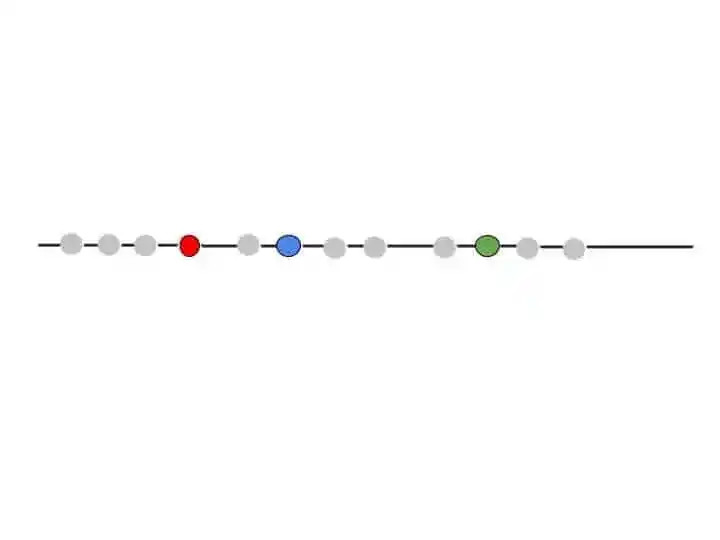
Now the next step is-
Step 3
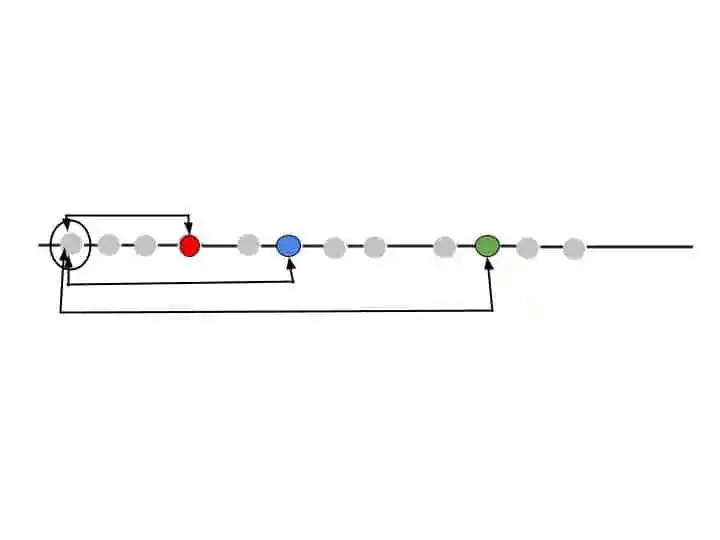
Calculate the distance between the first point and selected three clusters.
That means we have to choose the first point in our dataset and calculate the distance from all three randomly chosen clusters.
For calculating the distance, you can use the Euclidean distance formula.
So, we calculate the distance from the first point to all three clusters.
Step 4
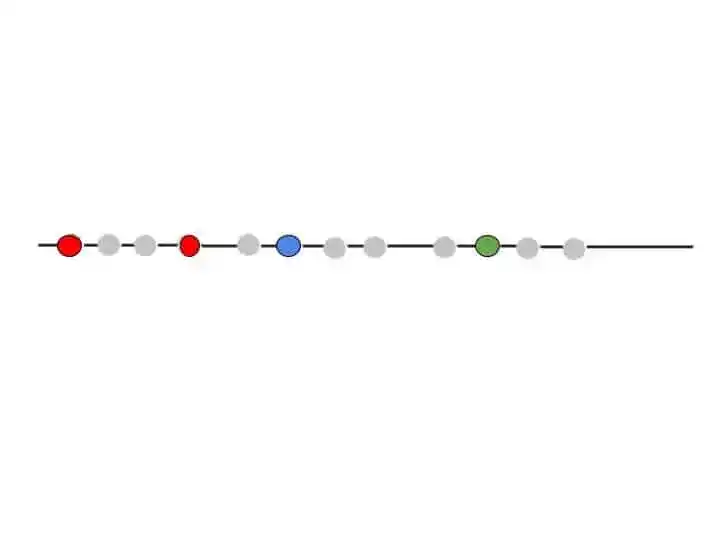
After calculating the distance, assign that first point to the nearest cluster. In other words, assign to the clusters whose distance is minimum to that point.
In that example, this first point is near to the Red Cluster. That’s why this first point came under Red Cluster. As you can see in that image-
Step 5
After assigning this first point to Red Cluster, we need to calculate the new centroid for Red Cluster.
We calculate the new centroid in the same way as we calculate the mean. I will explain in the next section, where I will explain the solved example of K means clustering.
Suppose we calculate the new centroid for the red cluster that lies something here-
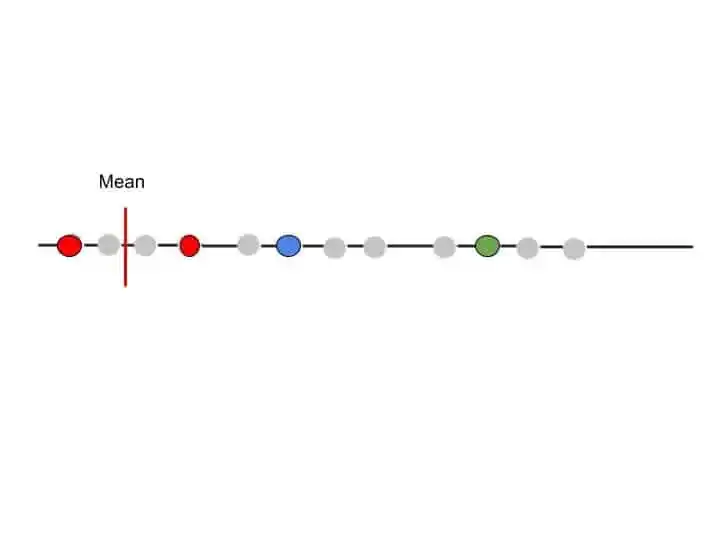
So, our first point is assigned to the Red cluster. Now we take the second data point and repeat the same procedure as we did for the first data point.
Calculate the distance from all three clusters and whose distance is minimum from that second point, we assign to that cluster.
So after performing the same step with all data points, we get our final result. That looks something like that-
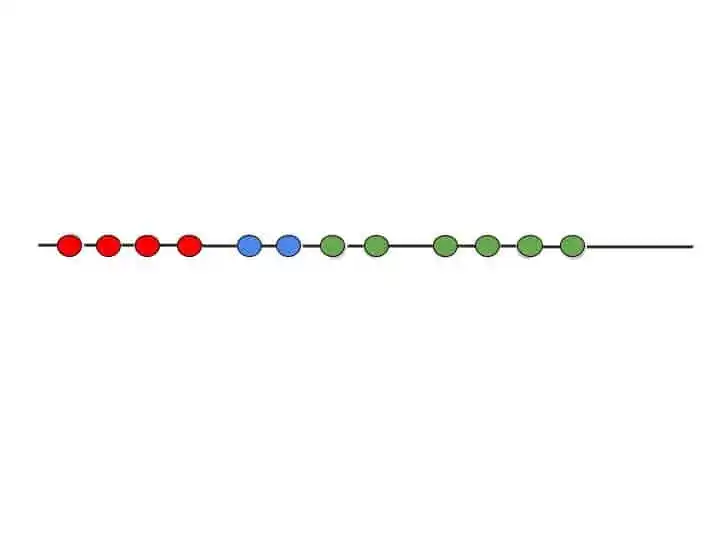
This result is not the same as we expect in the beginning.
Why we didn’t get the same result?.
The answer is due to random points selection. At step 2, we randomly select some data points and make them three clusters.
So, what will happen if we select some other random data points for clusters?.
The answer is we will get some different results from that result. There may be some data points that are in the green cluster present in the red cluster. That means data points change based on the randomly selected clusters.
So, K means clustering algorithms iterates over again and again unless and until the data points within each cluster stop changing.
That means it again starts from the beginning and repeat all the 5 steps and check the result. When no data points change its cluster location, K means clustering stops.
Now you may be wondering, How many Iteration it performs?
So, it depends on you. If you tell the machine to perform 30 iterations. So it will perform 30 iterations. It doesn’t mean that in 30 iterations, you will get different results. After some iterations, you will get the same result again and again. And that represents that K means clustering perfectly cluster the data points.
I hope now you understood the work procedure of K means clustering algorithm.
But you may be wondering How to the K value. Right?
So, let’s see how you can choose the K value in K means clustering.
How to Choose K Value in K Means Clustering Algorithm?
This is the most common question that comes into mind when someone learns K means Clustering.
How to choose K Value, is there any formula for choosing the K value?
So, yes there is a formula that is known as WCSS ( Within Cluster Sum of Square).
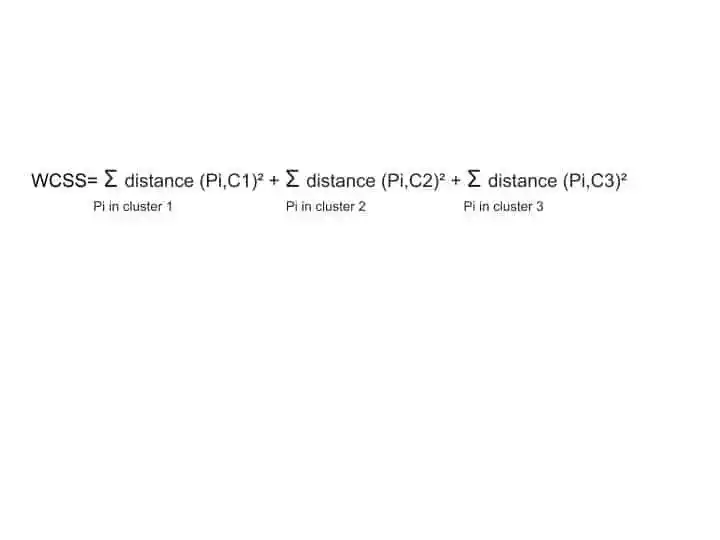
This formula is for 3 clusters. Here , we take all the points in each cluster and then we are calculating the distance for each point to the cluster.
Suppose for cluster 1, we take all the points in cluster 1, and then we calculate the distance from each point to the cluster. And then we sumup.
So for k=1, the value of WCSS is larger. As we increase the number of clusters or K, the value of WCSS decreases.
So, how many clusters or k we have?.
The answer is we can have as many clusters as we have data points. That means if we have 30 data points, so we can have 30 clusters. In that case, Every single point has its own cluster.
Suppose when you have 30 data points and you have 30 clusters. Each data point has its own cluster. In that case, what is the value of WCSS?
The WCSS become 0. Because each point has its own centroid, so the distance between the point and centroid becomes 0.
So, as the WCSS becomes lower, the higher the number of clusters, and the more accurate the result.
But how to find the optimal number of clusters?.
The answer is with the help of the Elbow Method.
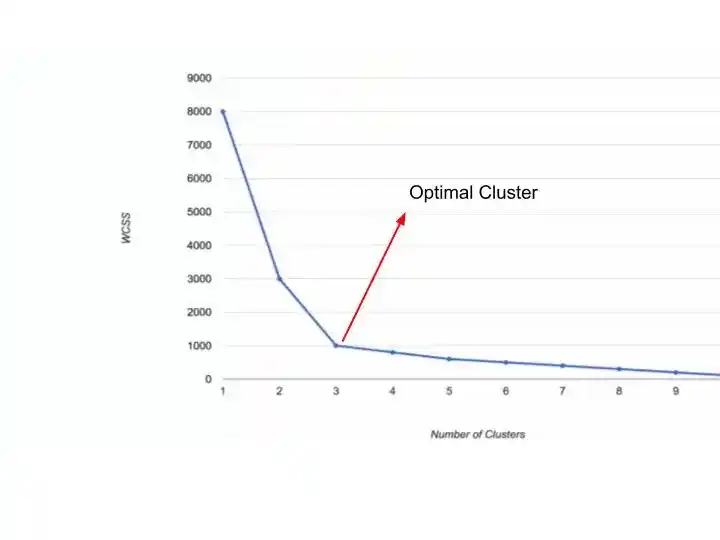
Elbow Method is the visual method. Where you decide the optimal number of clusters with the help of a chart.
As you can see in that image, there is a huge change from K=1 to K=2. Because WCSS value decreases from 8000 to 3000.
From k=2 to k=3, there is also a huge change. WCSS value changes from 3000 to 1000.
But, after k=3, there is no huge change in WCSS value.
So, you can say that k=3 is the optimal number of clusters for that data points.
So, that’s all about how to choose optimal K value.
I hope you understood the method.
Now let’s see some manually solved examples in K means clustering.
Solved Numeric Example of K Means Clustering Algorithm
Solving a numeric example of K Means Clustering is fun.
So, Are you excited?
Yes.
Let’s solve it-
Suppose we have the following dataset. Where we have two variables- Age and Salary.
| Age | Salary |
|---|---|
| 30 | 45000 |
| 25 | 30000 |
| 35 | 60000 |
| 40 | 90000 |
| 50 | 110000 |
So as you learned the steps of K Means clustering in the previous section. We will follow the same steps in that numerical example.
Step 1
The first step is- Choose the number of Clusters.
Suppose we have chosen k=2.
Step 2
As we have chosen the number of clusters as 2. That means we have to choose 2 random points from our dataset to make them cluster.
Suppose we have chosen the first two points and make then cluster-
So the K1 is (30, 45000) -> Centroid/ Cluster 1
and k2 is (25, 30000) -> Centroid/ Cluster 2
Step 3
After choosing 2 random clusters, its time to pick the first data point from the dataset, and calculate the distance from both clusters.
For calculating the distance, we use the Euclidean distance formula.
The formula for Euclidean distance is-
Euclidean Distance = √ (Xo-Xc) ² + (Yo-Yc) ²
Here X represents Age and Y represents Salary.
Xo and Yo represent Observed value.
And Xc and Yc represent Centroid value.
As we have chosen the first two rows as clusters. So our first data point starts from row 3.
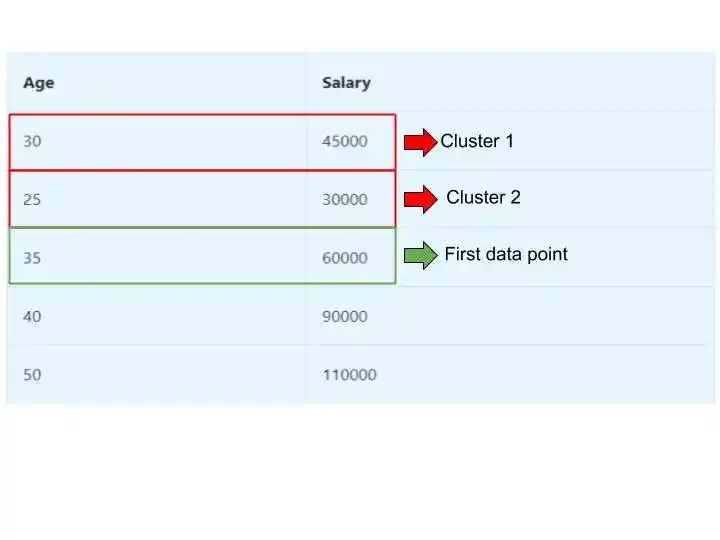
So, Row 3 has the following values – (35, 60000).
Now we calculate the Euclidean Distance for both clusters-
For Cluster/ Centroid 1-
= √ (35-30) ² + (60000-45000) ²
= √ 5 ² +15000 ²
= 15000.
For Cluster/Centroid 2-
= √ (35-25) ² + (60000-30000) ²
= √ 10 ² +30000 ²
= 30000
So, we have calculated the distance for Row 3 from both clusters.
Now we check which cluster has a minimum Euclidean distance.
So, Cluster 1 has a minimum distance of 15000.
That’s why Row 3 will go into Cluster 1.
Now we have – Cluster 1 ={ Row 1, Row 3}
and Cluster 2= {Row 2}
Step 4
Now, we have to find a new centroid value for Cluster 1.
Why only Cluster 1?
Because Row 3 is assigned to Cluster 1. So we need to calculate a new centroid for cluster 1. Cluster 2 will be the same as previously.
Whenever a new data point is assigned to any cluster, you need to calculate a new centroid value for that cluster.
How to Calculate a new centroid for Cluster 1?
You need to simply add values of Row 1, which is cluster 1 and Row 3.
Row 1 -(30, 45000)
Row 3- (35,60000)
So, to find a new centroid for Cluster 1-
Cluster 1 centroid = (30+35/2, 45000+60000/2)
= (47.5, 75000)
So, this is the new centroid value for Cluster 1 = (47.5, 75000)
Step 5
Now we have calculated the Cluster 1 value and we already have cluster 2 value.
Its time to select the Row 4 and repeat the same step.
Find the distance from both cluster, assign the Row 4 to the cluster who has minimum Distance.
Then calculate the new centroid value for the cluster in which you assign Row 4.
Repeat this whole procedure until all data points are separated into 2 clusters.
I hope now you understood how to solve the Numeric Example of K Means Clustering Algorithm.
Now its time to wrap up.
Conclusion
In this article, you learned everything related to the k Means Clustering Algorithm.
Specifically, you learned-
- What is the Clustering, Types of Clustering?
- What is K Means Clustering Algorithm, How does the K Means Clustering algorithm works, How to choose k value?
- Solved Numeric Example of K Means clustering?
I tried to make this article simple and easy for you. But still, if you have any doubt, feel free to ask me in the comment section. I will do my best to clear your doubt.
FAQ
Learn the Basics of Machine Learning Here
Are you ML Beginner and confused, from where to start ML, then read my BLOG – How do I learn Machine Learning?
If you are looking for Machine Learning Algorithms, then read my Blog – Top 5 Machine Learning Algorithm.
If you are wondering about Machine Learning, read this Blog- What is Machine Learning?
Thank YOU!
Though of the Day…
‘ Anyone who stops learning is old, whether at twenty or eighty. Anyone who keeps learning stays young.
– Henry Ford
Written By Aqsa Zafar
Founder of MLTUT, Machine Learning Ph.D. scholar at Dayananda Sagar University. Research on social media depression detection. Create tutorials on ML and data science for diverse applications. Passionate about sharing knowledge through website and social media.
