If you are looking for a Udacity Data Visualization Nanodegree Review, then you are in the right place. After reading this Udacity Data Visualization Nanodegree Review, you will have a clear thought about whether to enroll in Udacity Data Visualization Nanodegree Program or not.
Now without any further ado, let’s start the Udacity Data Visualization Nanodegree Review.
- Projects Covered in Udacity Data Visualization Nanodegree
- Content Covered in Udacity Data Visualization Nanodegree
- Who Should Enroll in Udacity Data Visualization Nanodegree?
- Are Instructors Experienced?
- How Much Time and Money do You have to Spend in Udacity Data Visualization Nanodegree?
- How to Complete the Udacity Data Visualization Nanodegree in Less time and Money?
- Pros & Cons of Udacity Data Visualization Nanodegree
- Final Thought
- Student Reviews
- Conclusion
Udacity Data Visualization Nanodegree Review
The most important points you have to consider in the Udacity Data Visualization Nanodegree Program are its content, the projects covered, and the prerequisites.
Right…?
So, first, let’s see what projects are covered in Udacity Data Visualization Nanodegree Program because data visualization is all about implementation. And if the program doesn’t focus on the implementation part, then I believe the program is not worth it.
Projects Covered in Udacity Data Visualization Nanodegree
The best thing about Udacity Data Visualization Nanodegree is that it is based on projects. That means after every set of courses, there is a project that you need to submit.
Due to its practical approach, you will get to learn various new things. Because when you implement it by yourself, your understanding becomes stronger.
Project 1- Build Data Dashboards
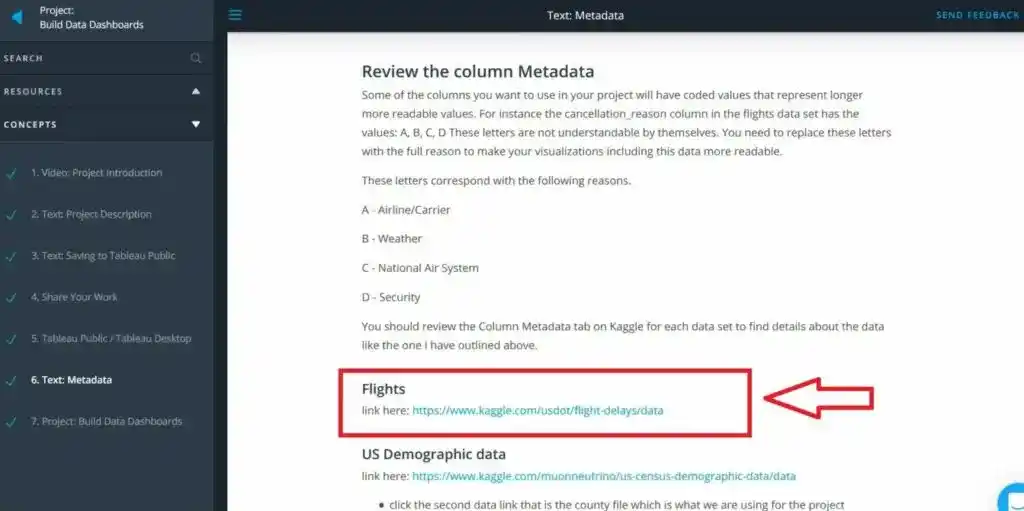
This is the first project of the Udacity Data Visualization Nanodegree program. In this project, Udacity provided a US Flight Delays and Cancellations dataset from Kaggle.
And you have to visualize the quality of airlines and airports. Before this project, the Udacity instructor teaches you the basics of data visualization and how to create visualizations in Tableau. You use the concepts learned in course 1 to complete this project.
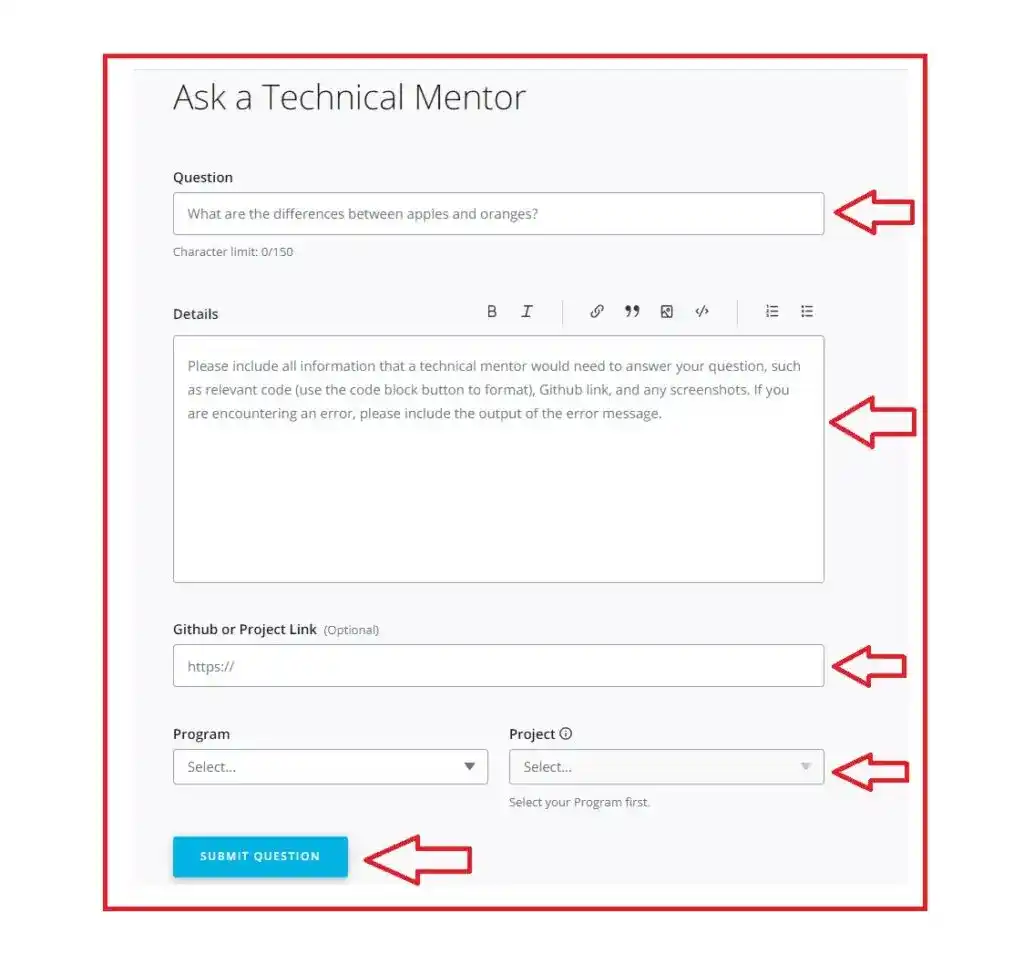
The best part of the Udacity Nanodegree is that you will get technical mentor support. So that whenever you are stuck in the project, you can ask the mentor.
Project 2- Design a Dashboard
This project is all about designing a dashboard. There are two parts to this project. This is not an easy project. This is a long project, where you have to implement the concepts learned in course 2 which is Dashboard Design.
This project helps you to work on real-world datasets and make you comfortable with designing a dashboard using Tableau. After completing this project, you have to submit the project in a zip file. And the reviewer reviews your project and gives feedback on your work. Overall, this project is good for your resume.
Project 3- Build a Data Story
After learning the data storytelling concepts, this is the project which you have to complete. For this project, Udacity provides a Movies Metadata dataset. You have to build a story by yourself. This project force you to think as a data science consultant and craft a story from the data.
Overall, this is not an easy project, you have to take help from your mentor and this project requires some google searches too. But this project gave you insights into the data storytelling process and it will help you in your interview.
Project 4- Animate a Data Story
This project is all about advanced data visualization and storytelling techniques. This project will be helpful for your resume. In this project, Udacity provides a World Bank Indicators data file for creating a data visualization.
During this project, you will learn various new and advanced concepts such as how to add audio to your story, how to animate the data, etc.
Overall, this is an advanced-level project which requires time and effort. But you can add this project to your resume.
Project 5- Reviewing MakeoverMonday Dashboards
This is the last project of Udacity Data Visualization Nanodegree. In this capstone project, you have to write how you can improve the current data visualization charts from Makeover Monday. The first step in this project is to collect the data. After data collection, you have to explore the data and define your problem statement. Next, you have to finish the data visualization process and complete the story.
You can take help from the Technical mentor support.
So, these are the 5 projects in Udacity Data Visualization Nanodegree, that you have to complete and submit. I believe that these projects will help you to sharpen your data visualization skills and strengthen your Resume. You can discuss these projects during your interview.
Now the next most important thing you must know about Udacity Data Visualization Nanodegree is the content covered in this program.
Content Covered in Udacity Data Visualization Nanodegree
Udacity Data Visualization Nanodegree program has 4 courses and each course has some lessons. So, let’s see what will you learn in this Udacity Data Visualization Nanodegree–
Course 1- Intro to Data Visualization
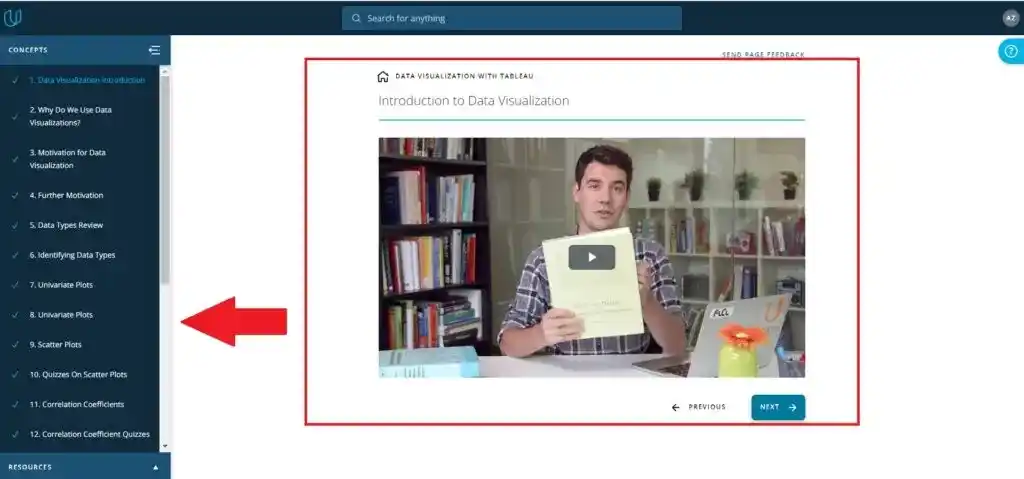
This is the first course and has 4 lessons. The course begins with the data visualization basics and covers why data visualization is essential in data science. After that, you will learn different types of plots such as Univariate Plots, Scatter Plots, Line Plots, etc.
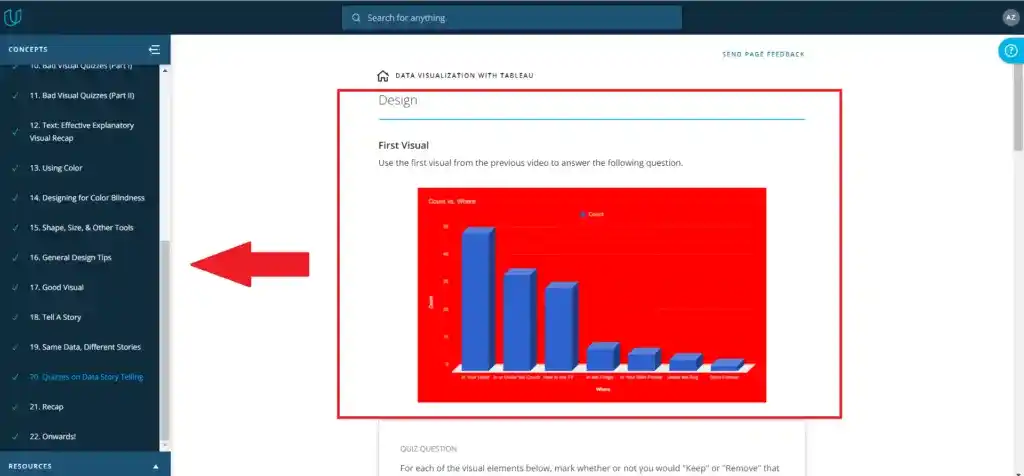
After that, you will learn the basics of design and understand Exploratory vs. Explanatory Analyses, What Makes a Bad Visual, Design Integrity, Same Data, Different Stories, and many other interesting terms.
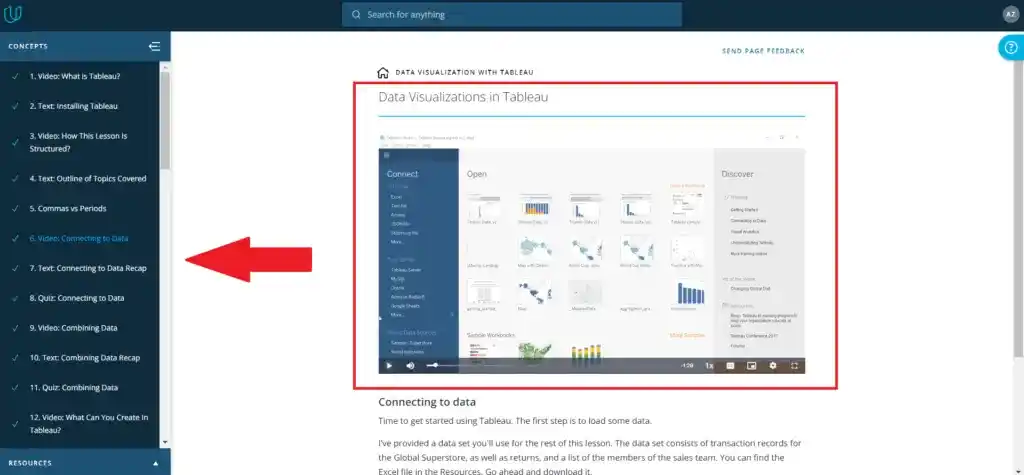
The next lesson will teach Tableau Basics. This is a detailed lesson on Tableau. You will learn how to import data into Tableau, how to connect data from multiple sources, how to perform aggregations in Tableau, and much more.
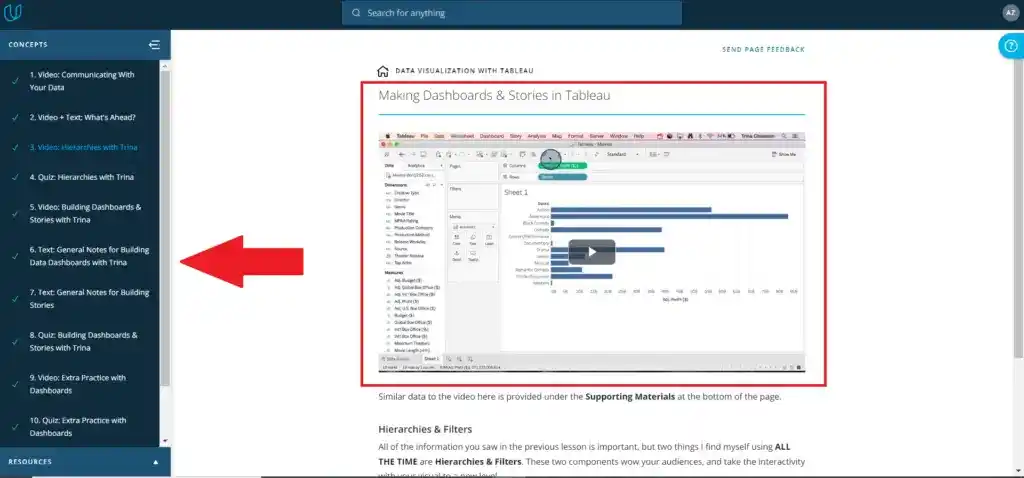
The last lesson will teach how to make dashboards and stories in Tableau. Overall, the complete course is a perfect balance between theory and practice. Each lesson has various quizzes and exercises. These quizzes will test your understanding.
Course 2- Dashboard Design
In the second course of Udacity Data Visualization Nanodegree, you will learn how to design a dashboard. There are 3 lessons in this course. In the first lesson, you will understand the planning phase. You will learn how to build a dashboard prototype in the design phase. The last lesson will cover Prototyping & Feedback.
Overall, this lesson is easy to finish and covers some essential concepts of dashboard designing. There are quizzes in this course where you will experiment and test your understanding. The quizzes help you to improve your knowledge.
Course 3- Data Storytelling
This course is all about data storytelling. Data Storytelling is an essential step in data science. In this course, you will learn the basics of data storytelling such as how to create an issue tree and hypothesis-driven structure.
The instructor of this course also explains Limitations and Biases. The method of explanation is easy to understand. Most of the time, the instructors use visual representations to teach the concepts, which is very helpful.
Course 4- Advanced Data Storytelling
This course will cover some advanced techniques of data visualization and storytelling. This is not an easy course. You have to memorize various new terms. I would suggest you take notes while learning. So that you can refer to these notes in the future.
Throughout this course, you will learn how to create interesting data stories in Tableau, how to animate the data, and how to add audio to your data story.
Their visual representation helps you to understand complex terms easily.
If you ask me how is the content and projects of Udacity Data Visualization Nanodegree, I would say it is worth it. The course content is well-structured and advanced. The instructors of the Nanodegree program explain each concept visually and easily.
The projects covered in this Nanodegree Program are based on real-world problems. And these projects will be helpful to your resume.
Now, the next most important point you must clear before enrolling in Udacity Data Visualization Nanodegree is the prerequisites.
Who Should Enroll in Udacity Data Visualization Nanodegree?
This Udacity Data Visualization Nanodegree is good for those who have familiarity with descriptive statistics, like median, median, mode, variance, standard deviations, and distributions.
When you enroll in the Nanodegree Program, you will get elective courses too. And in these elective courses, you can learn these topics such as statistics and spreadsheets.
Without having knowledge of basic statistics, I would not suggest this Udacity Data Visualization Nanodegree program.
If you are familiar with these concepts, then you must know a few more things about Udacity Data Visualization Nanodegree before enrolling.
Are Instructors Experienced?
- Mat Leonard– Instructional Designer at Kaggle.
- Josh Bernhard – Data Scientist at Nerd Wallet
- Robert Crocker– Data Visualization consultant at IBM.
- Malavica Sridhar– Senior Product Manager at CIRCLEUP.
- Ben Jones– CEO of Data Literacy
As you saw, all instructors are experienced and knowledgeable. And learning from such instructors is amazing and helpful. That is the reason I love Udacity.
Now, let’s see the price and duration of the Udacity Data Visualization Nanodegree.
How Much Time and Money do You have to Spend in Udacity Data Visualization Nanodegree?
According to Udacity, the Udacity Data Visualization Nanodegree program will take 4 months to complete if you spend 10 hours per week. And for 4 months they cost around $1199. But Udacity offers two options- One is either pay the complete amount upfront or you can pay monthly installments of $399/month.
I know Udacity Data Visualization Nanodegree is expensive as compared to other MOOCs. That’s why I would like to share some methods to save some money.
How to Complete the Udacity Data Visualization Nanodegree in Less time and Money?
So there are the following 3 methods that you can use to save a few bucks in the Udacity Data Visualization Nanodegree–
- Get Some Discounts
- Complete the whole Nanodegree in less time.
- Apply for Udacity Scholarship
Now, let’s see all these methods in detail-
1. Get Some Discounts
Most of the time, Udacity offers some discounts. When they offer a discount, it appears something like that-
You need to apply the coupon provided by Udacity at the time of checkout. And you will get a discount on the Udacity Data Visualization Nanodegree. So to get a discount on Udacity, you need to wait for their sale.
You can check the current Discount of Udacity here.
2. Complete the whole Nanodegree in less time
To complete the Udacity Data Visualization Nanodegree program in less time, you need to manage your time productively.
You need to plan your day before and create a to-do list for each day. And you need to spend a good amount of time daily on the program.
According to Udacity, you need to spend 10 hours per week to complete the whole program in 4 months.
Right…?
That means you need to spend 1.5 hours daily, but if you double the time and give daily 3 hours, you can complete the whole Nanodegree program in 2 months.
For managing your time and avoiding any distractions, you can use the Pomodoro technique to increase your learning.
And you can also implement the project phases after watching the related lecture. By doing this way, you can save your time by watching one video two times. One at the time of learning and the second at the time of working on the project.
I hope these tips will help you to complete the Udacity Data Visualization Nanodegree program in less time. And you can save two months’ fees.
3. Apply for Udacity Scholarship
To apply for Udacity Scholarship, you need to go on their Scholarship page, which looks like something like that-
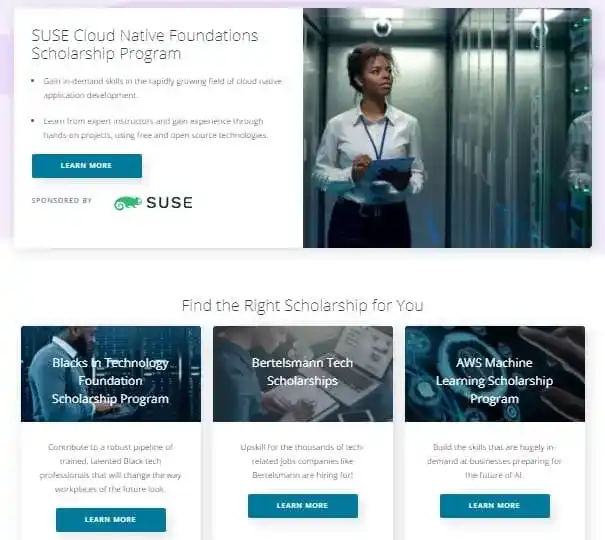
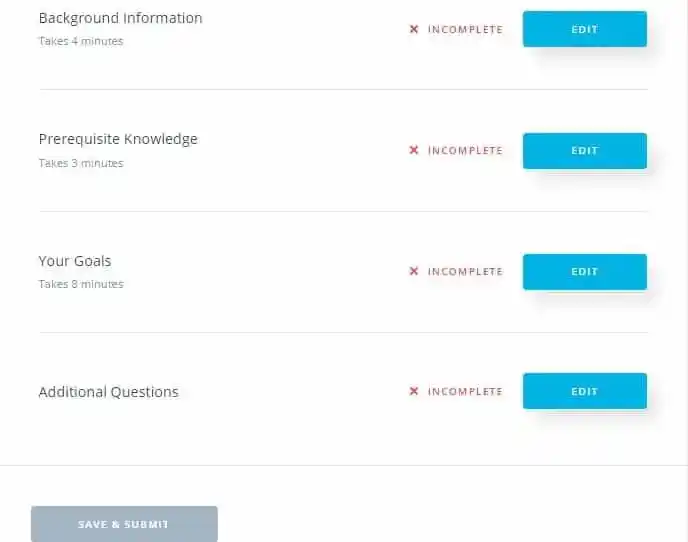
On this page, you have to find the scholarship for the program you want to enroll in. If you found your Nanodegree program on the list, then you need to apply for the scholarship by filling out these details-
- Background Information
- Prerequisite Knowledge
- Your Goals
- Additional Questions
In the background information section, they will ask about your Country, Age, Gender, ethnicity, the highest level of education, current job role, years of professional experience, and how many hours can you dedicate to the program per week.
The prerequisite Knowledge section varies depending on the Nanodegree program you are applying for.
In the Goals section, you have to tell your primary purpose in participating in this scholarship program, what you hope to accomplish through this program?, and Why should you receive a scholarship.
In the last section which is Additional Questions, you have to agree to their terms and conditions.
You should fill out the Goals section very carefully so that you increase your chance of getting a scholarship.
After filling out these details, you need to click on the “Save and Submit“ button. And by doing so, you have applied for Udacity Scholarship. And if you are selected, then you will be notified via email.
But if your program is not listed in the scholarship section, then you fill out this form on the Scholarship page section-
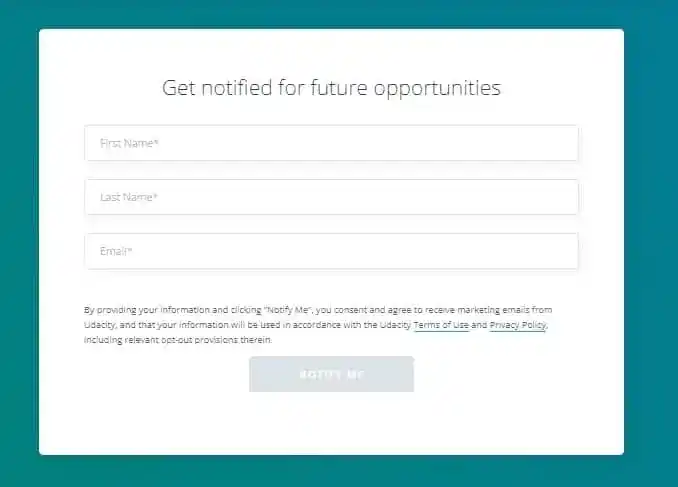
So, whenever the scholarship will available, you will be notified. I hope now you understood the procedure.
If you follow any of these three methods, you can save a few bucks.
Pros & Cons of Udacity Data Visualization Nanodegree
Pros-
- The content of the program is up to date and combined with the latest trends and best practices.
- All the projects are created by the leaders in the industry that have partnered with Udacity. And all projects are based on Real- World problems.
- You will get Technical mentor support and the mentor will guide you from the start of your Nanodegree program until you finish the whole program.
- Udacity provides a great community for help. They have a Stackoverflow-style Q&A forum for people who are stuck with assignments.
Cons-
- Udacity Nanodegree program is expensive as compared to other MOOCs platforms.
- After completing the Nanodegree program, you can’t access the course material. Maybe Udacity does this to avoid misuse.
- Udacity doesn’t have any IOS and android apps. So, you can’t study on your smartphones and outside the house.
Final Thought
This Udacity Data Visualization Nanodegree is good for those who have familiarity with descriptive statistics, like median, median, mode, variance, standard deviations, and distributions. The content of the Udacity Data Visualization Nanodegree program is up to date and combined with the latest trends and best practices.
Student Reviews
That’s all. It’s time to wrap up this Udacity Data Visualization Nanodegree Review–
Conclusion
I hope this Udacity Data Visualization Nanodegree Review helped you and cleared your doubts regarding the Udacity Data Visualization Nanodegree program. If you have any doubts or questions, feel free to ask me in the comment section.
All the Best!
Happy Learning!
You May Also Be Interested In
Udacity SQL Nanodegree Review- Latest 2026-[Is It Worth It to Enroll?]
6 Udacity Competitors and Udacity Alternatives You Must Know
How is Udacity Data Analyst Nanodegree?- Latest Review
Udacity Data Engineering Nanodegree Review in 2026- Pros & Cons
Is Udacity Data Science Nanodegree Worth It?
Data Analyst Online Certification to Become a Successful Data Analyst
Google Data Analytics Certification vs IBM Data Analyst- Which is Better?
IBM Data Science vs IBM Data Analyst- Which One is Better for you?
8 Best Books on Data Science with Python You Must Read
14 Best+Free Data Science with Python Courses Online- [Bestseller]
Thank YOU!
Explore More about Data Science, Visit Here
Though of the Day…
‘ It’s what you learn after you know it all that counts.’
– John Wooden

Written By Aqsa Zafar
Aqsa Zafar is a Ph.D. scholar in Machine Learning at Dayananda Sagar University, specializing in Natural Language Processing and Deep Learning. She has published research in AI applications for mental health and actively shares insights on data science, machine learning, and generative AI through MLTUT. With a strong background in computer science (B.Tech and M.Tech), Aqsa combines academic expertise with practical experience to help learners and professionals understand and apply AI in real-world scenarios.