Do you want to know What Simple Linear Regression is and How It Works? If yes, then give your few minutes to this blog to know What Simple Linear Regression is and Its functionality?
Hello, & Welcome!
In this blog, I am gonna tell you-
- What is Simple Linear Regression?
- How Simple Linear Regression Works?
- How to Find the Best Fit Line?
Firstly, I would like to start with-
What is Simple Linear Regression?
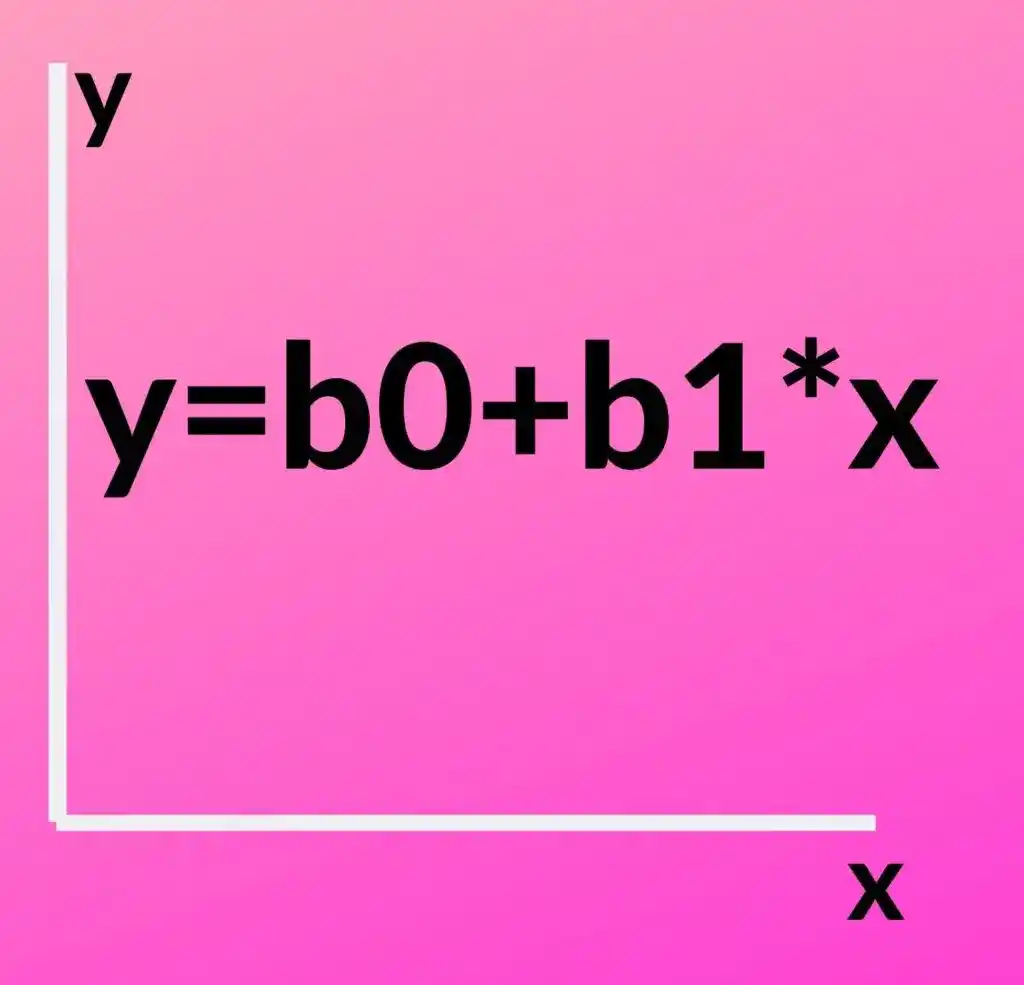
Simple Linear Regression solves the Classification problem. The formula for Simple Linear Regression is-
y=b0+b1*x
This is the formula of slope or line on the x and y-axis.
Here Y is a dependent variable. For example, in the company, how does person’s salary change with respect to the year of experience. So, in that case, Y is a dependent variable.
Or, how much student gets grade to depend on how much time he or she gives to study, in that case, Y will be the dependent variable.
The dependent variable means its happening depends upon some other factors.
X is an Independent variable. In simple linear regression only one independent variable, so no need to write x1 and x2, only one independent variable x. And this independent variable is causing the dependent variable to change.
b1 is the coefficient for independent variable x, which represents how a unit change in x affects the unit change in y. Take b1 as a translator or multiplier who connects between x and y.
You can’t say that x is directly proportional to y or you can’t say a change in x is directly equal to y. There might be a coefficient or proportion, to which proportion change is inflated or deflated.
b0 is constant.
How Simple Linear Regression Works?
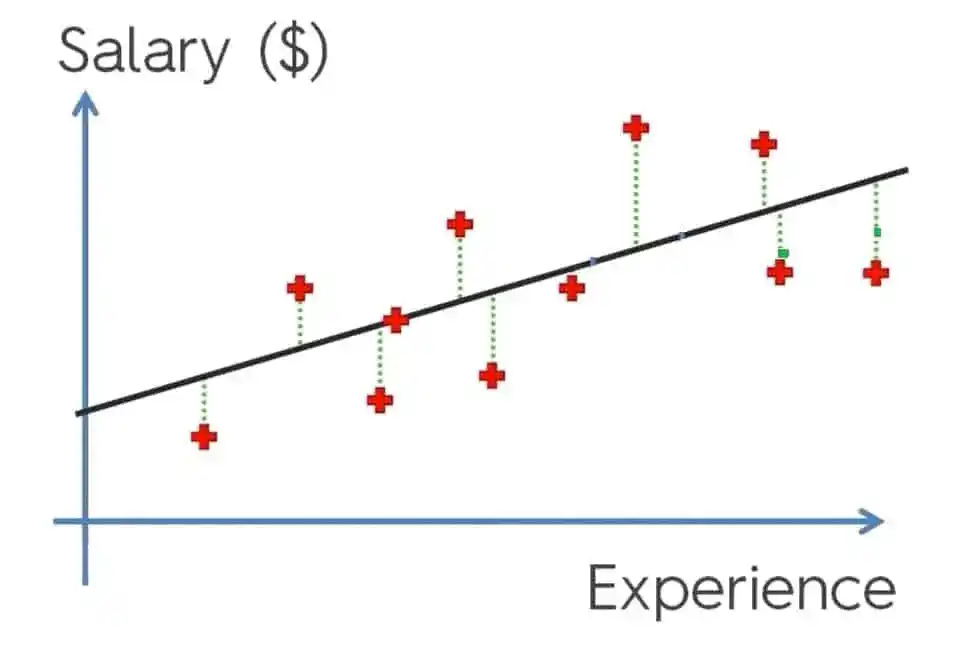
Now, let’s discuss how simple linear regression works. It works in a very straight forward manner. Here we got an x and y-axis, where we have experience and the salary of all employees in the company. Experience is on the x-axis and salary is one the y-axis.
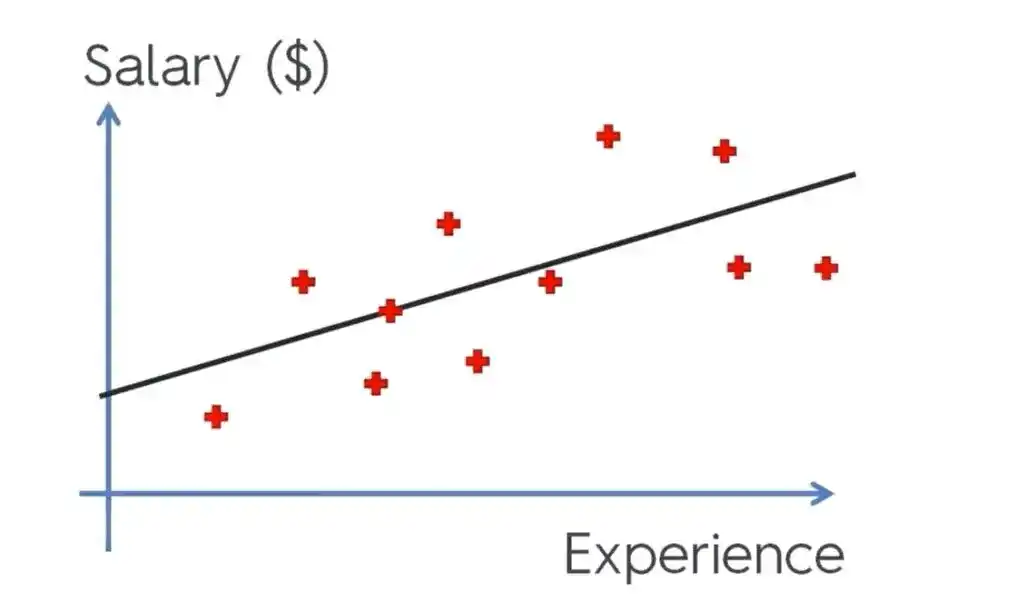
Here, we have to check how person’s salary depends upon it a year of experience.
In regression, there is no theory, it only works on evidence. Here we have data of a company how salary increases with respect to the experience.
The formula of regression-> y=b0+b1x
change into,
salary= b0+ b1* Experience
Which, is a formula of line or slope and In simple linear regression, we need to draw a line. That should be the best fit on the data.
Now let’s first discuss what is constant b0?
The constant is a point where the line crosses the y-axis or vertical line.
Let’s understand with the help of an example-
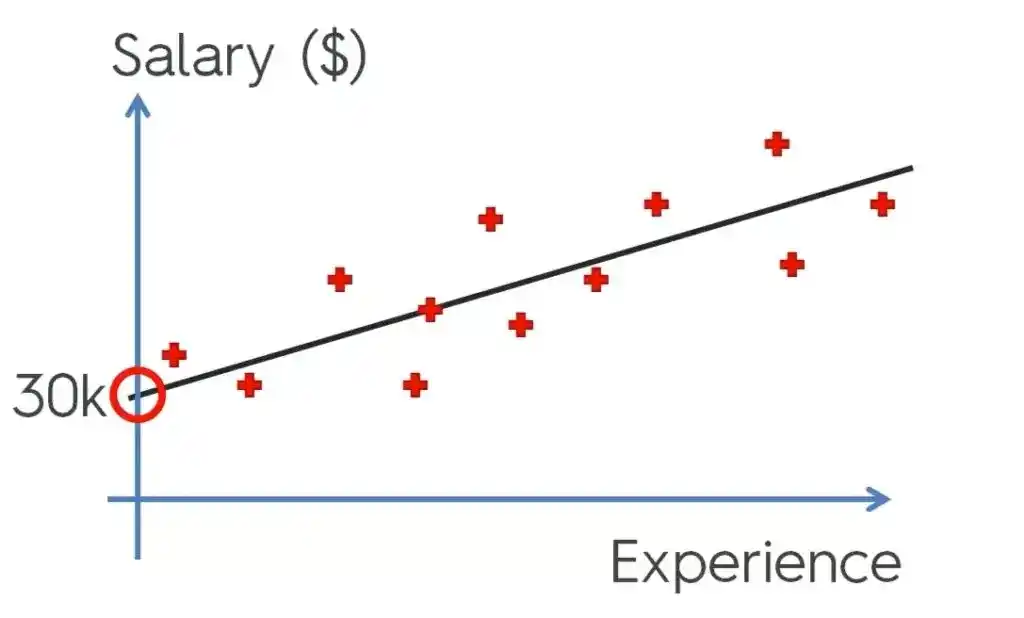
Suppose, here b0 is 30k because here line crosses the y-axis. Experience is 0, so b1*experience becomes 0 too. Therefore, b0 is 30k that’s why the salary is 30k.
Confused?
No worry! let’s understand with the help of formula.
salary= b0+b1*experience
when an experience is 0, so we get only,
salary=b0
and b0 is 30k, that’s why salary is 30k at the 0-year experience.
I hope now you understand it.
What is b1?
b1 is the slope of the line. In short, the more the experience, the more salary they get. That means if the slope is higher then experience is also high and the employees get more salary.
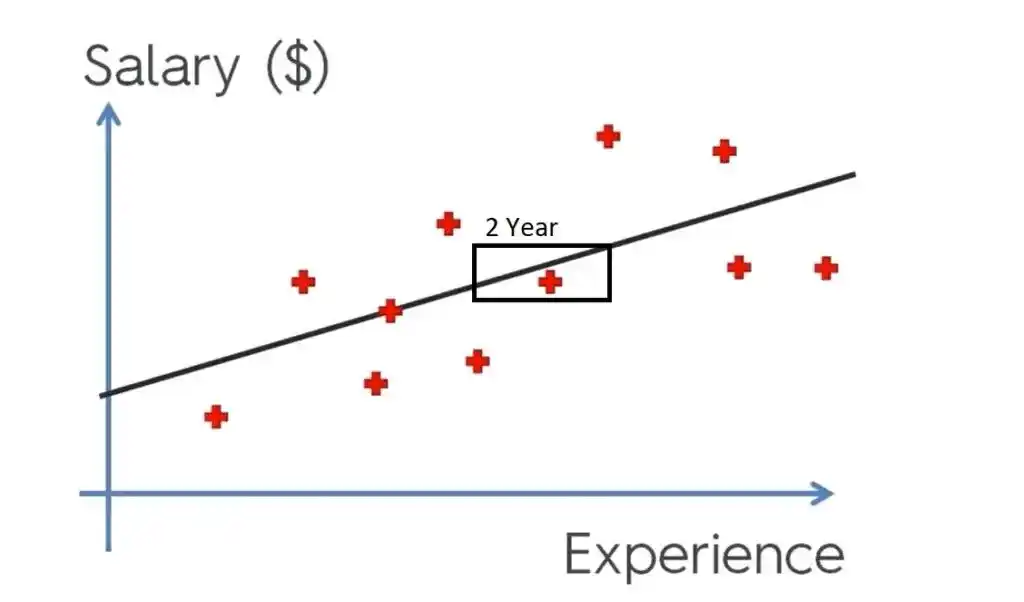
Suppose here, the slope is high at 2 years of experience so the salary is higher as compared to the 0-year experience.
So, that’s all about simple linear regression. Now in the next section, we will discuss about best fit line.
How to Find the Best Fit Line?
We have this chart, red dots are real observation, and we draw a line which best fit the data.
Now to find a best-fit line, first, draw one random line and then draw some vertical lines from actual observation.
Let’s take one of this and understand. Here you can see the red dot is where person is sitting in terms of salary. Suppose a person has 10 years of experience and earning 100k dollars.
The red one is yi as the actual observation and the green one is yi^ as the predicted observation.
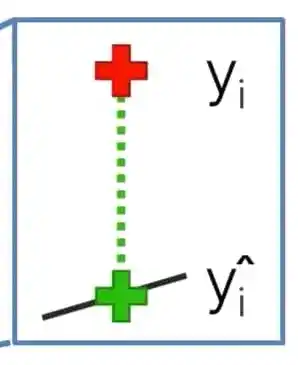
The dotted green line is the difference between what he is actually earning and what he should be earning. In short, it is the difference between actual and predicted.
Now to get the best fit line, you need to calculate-
sum(y-y^)2
Here, y is actual earning and y^ is predicted earning, find the difference between them and then square their sum.
after calculating the square sum find the minimum one.
So, in simple words what simple linear regression does? It draws lots of vertical lines and calculate their sum of a square and record these somewhere and then finds the minimum sum of the square. That line is the best-fitted line and this method is known as Ordinary Least Square Method.
I hope, now you have a clear idea about What Simple Linear Regression is and How It Works?
Are you ML Beginner and confused, from where to start ML, then read my BLOG – How do I learn Machine Learning?
If you are looking for Machine Learning Algorithms, then read my Blog – Top 5 Machine Learning Algorithm.
If you are wondering about Machine Learning, read this Blog- What is Machine Learning?
Enjoy Machine Learning
All the Best!
Wanna Learn Basics of ML?. Learn Here.
Thank YOU!
Though of the Day…
‘ It’s what you learn after you know it all that counts.’
– John Wooden

Written By Aqsa Zafar
Aqsa Zafar is a Ph.D. scholar in Machine Learning at Dayananda Sagar University, specializing in Natural Language Processing and Deep Learning. She has published research in AI applications for mental health and actively shares insights on data science, machine learning, and generative AI through MLTUT. With a strong background in computer science (B.Tech and M.Tech), Aqsa combines academic expertise with practical experience to help learners and professionals understand and apply AI in real-world scenarios.