Are you confused with the term “Bias Variance Trade-Off“? If yes, then don’t worry. In this article, I am gonna share What is Bias Variance Trade-Off in Machine Learning in a simplified way. So give your few minutes to this article and understand the concept of Bias Variance Trade-Off.
Now without any further ado, let’s get started-
What is Bias Variance Trade-Off in Machine Learning?
Before moving to Bias Variance Trade-Off, first understand what is Bias and Variance in machine learning?
What is Bias and Variance in Machine learning?
Supervised machine learning algorithms need a supervisor to learn and this supervisor is nothing but the training data. The training data is used to train the supervised machine learning algorithms.
In supervised machine learning, there are two values. One is the Actual value and another one is the Predicted value. The actual value is the value that we already have and the Predicted value is the value that the model predicts.
What is Bias?
Bias is the gap between the actual value and the predicted value. You might have heard High Bias and Low Bias. So the next question is- What are High Bias and Low Bias?
High Bias means the predicted value is far from the actual value. Or you can say there is a huge gap between the predicted value and the actual value.
Whereas Low Bias means the predicted value is closer to the actual value or there is a small gap between the actual and predicted value.
So you understood Bias, low bias, and high bias. Now let’s move to the Variance.
What is Variance?
Variance means how much-predicted values are scattered in relation to each other. In Variance, there is a Low Variance and High Variance.
Low variance means all the predicted values are in a close group and very close to each other. Whereas in high variance all the predicted values are far from each other.
Now let’s understand Low Bias, High Bias, Low Variance, and High Variance with the help of this image-
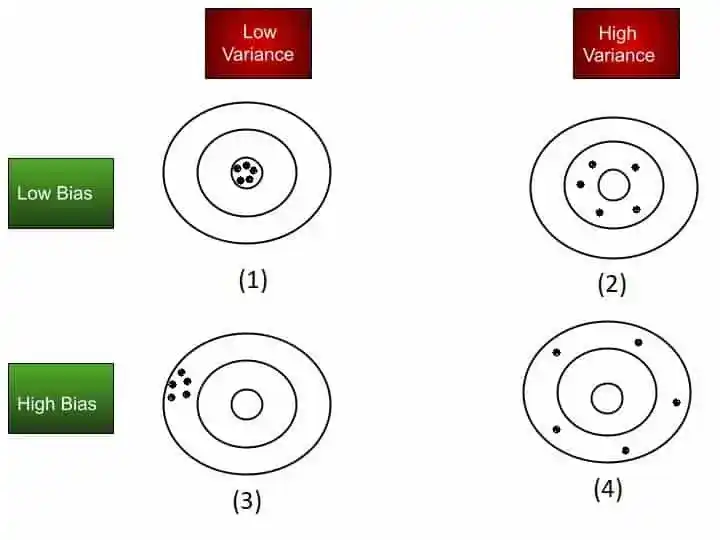
Note- In this image, the smallest circle is the target value.
So let’s start with scenario 1 (Low Bias and Low Variance)– As I mentioned earlier that low bias means the difference between the actual and predicted value is less. And Low variance means the predicted values are in a close group. That’s why you can see in scenario 1 all predicted values are closer to the target value(small circle) and forms a close cluster.
In scenario 2( Low Bias and High Variance)– Due to low bias, all the predicted values are closer to the target value(small circle) but due to high variance, the values are scattered and far from each other.
Let’s move to scenario 3( High Bias and Low Variance)– Due to high bias, the predicted values are far from the target value(small circle) but due to low variance they are in the closed group.
In the last scenario 4(High Bias and High Variance) all the predicted values are far from the target value because of high bias and far from each other due to high variance.
I hope now you understood the whole concept of Bias and Variance in machine learning. So let’s move to the Bias-Variance Trade-Off in Machine Learning.
Read Also- 10 Best Online Courses for Machine Learning with Python in 2026
Bias Variance Trade-Off in Machine Learning
We will understand the Bias Variance trade-off with the help of this graph-
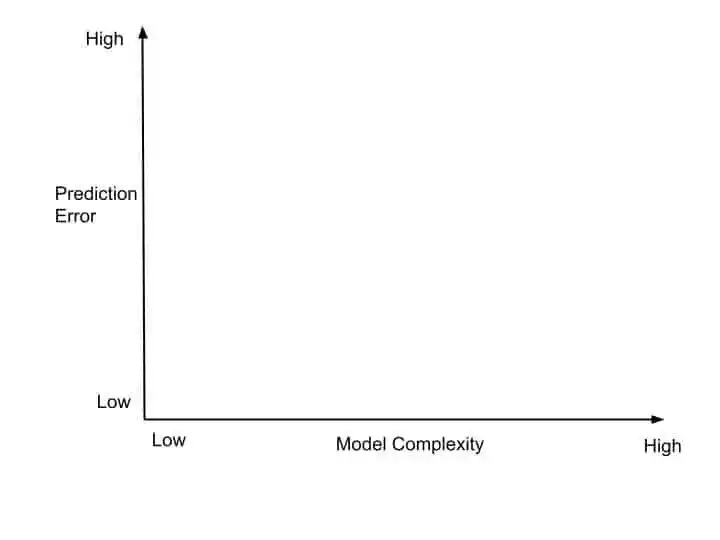
We will build this graph as we proceed with the concepts. As you can see in the graph, the Prediction error is on the Y-axis, and model complexity is on the X-axis. Both prediction error and model complexity has Low and High ends.
In supervised machine learning algorithms, we have Training data and Test data. So let’s move further with the graph. I will represent Test data with the Red circle and Training data with the Green circle in the graph.
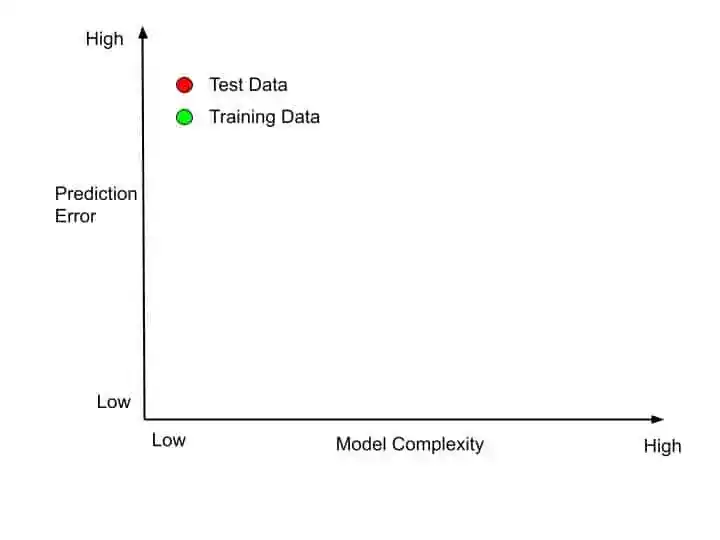
The position of Training data and test data is the starting point. And at this position, you can see the model complexity is low and the prediction error is high due to the High Bias and Low Variance scenario. This is the initial scenario of the model.
But then we will try to increase the model complexity and reduce the prediction error. This is our objective. So when we increase the model complexity from the low end to the high end, let’s see the behavior or the path of Test Data.
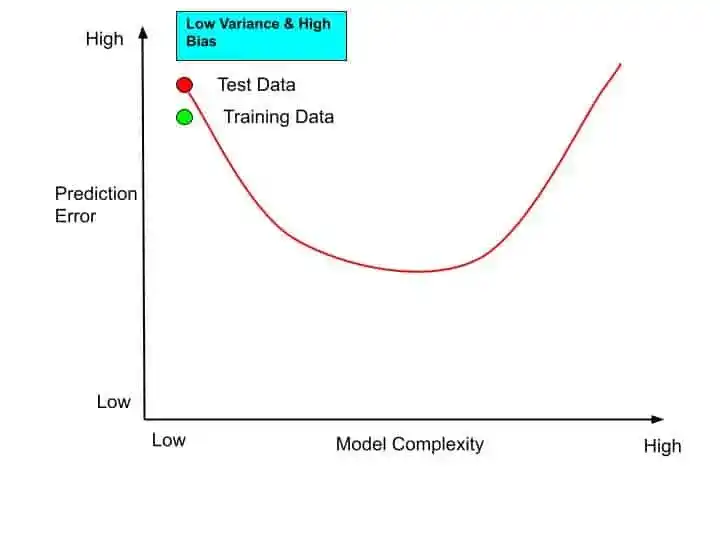
As you can see in the graph, when we tried to increase the model complexity, after a certain point, the prediction error of the Test data again increased.
Now let’s see the path and behavior of the Training data after increasing the model complexity.
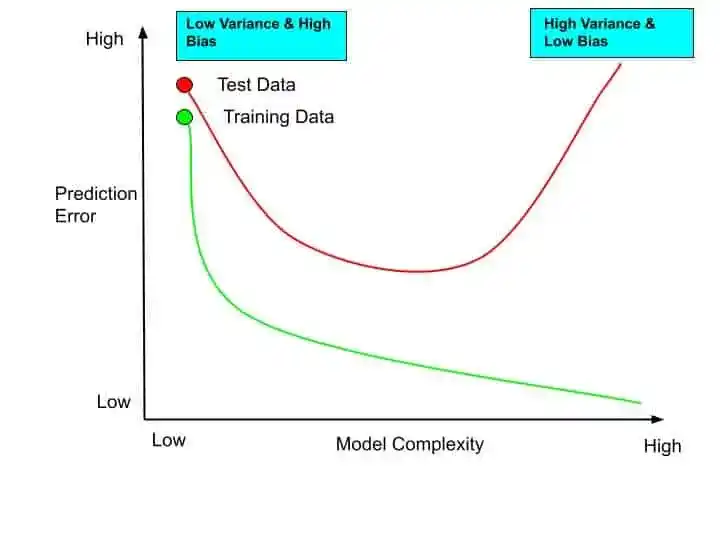
As you can see in this graph when we increased the model complexity of the model, the prediction error of the training data decreases.
And this overall behavior of Training data and Test data after increasing the model complexity is known as High Variance and Low Bias.
On the left side of the graph, there is a Low Variance and High Bias behavior whereas, on the right side of the graph, you can see the High Variance and Low Bias behavior. And on the left side, you will witness the Underfitting and on the right side, you will witness the Overfitting.
Read Also- 15 Best+FREE Udacity Machine Learning Courses in 2026
Overfitting & Underfitting
Overfitting is the problem when you give extra data to the training phase. Underfitting is the opposite of Overfitting. That means when you pass fewer data at the training phase. Then also your model faces a problem.
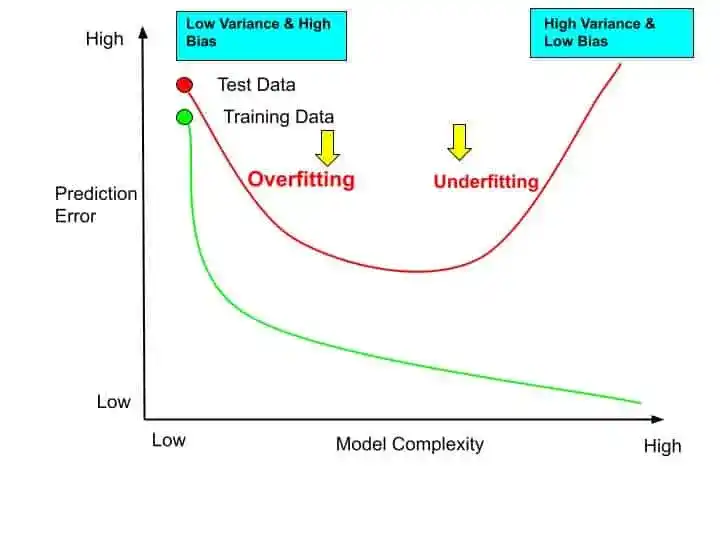
So in Underfitting, there is a high prediction error in both Training data and Test Data. And in Overfitting, where is High Variance and Low Bias, for Test Data, you will observe the Less Precision. Less precision means high prediction error.
Whereas for training data on the right side of the graph, you can see there is high precision which means low prediction error.
But now we have to find the best or optimal balance of prediction error between the Test data and training data. And where we can find this balance, obviously in the mid of the graph. And this mid-way is the illustration of Bias Variance Trade-Off.
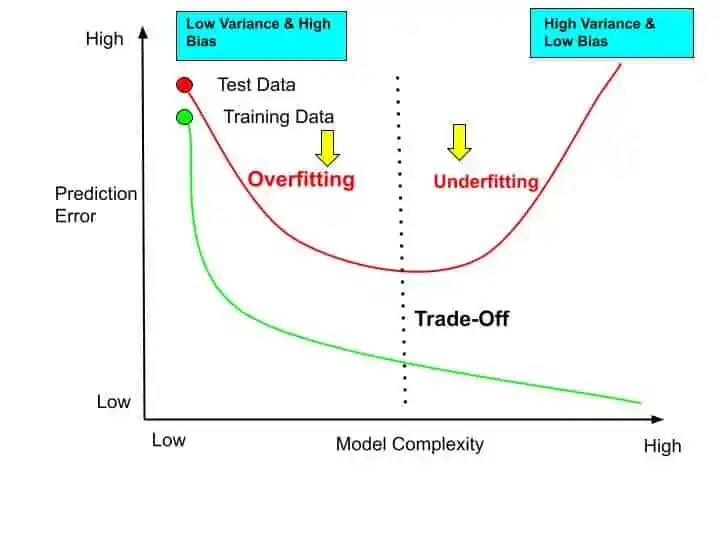
At this Trade-Off position, you can see the optimal balance of the prediction error between the Test data and Training data.
So this is all about the Bias Variance Trade-Off in Machine Learning. I hope you understood the whole concept easily. Now it’s time to wrap up.
Read Also- 10 Best Courses for Machine Learning on Coursera You Must Know- 2026
Conclusion
In this article, you understood Bias Variance Trade-Off in Machine Learning. If you have any questions, feel free to ask me in the comment section.
If you found this article helpful, kindly share it with others.
All the Best!
Happy Learning!
You May Also Interested In
Best Math Courses for Machine Learning- Find the Best One!
9 Best Tensorflow Courses & Certifications Online- Discover the Best One!
Machine Learning Engineer Career Path: Step by Step Complete Guide
Best Online Courses On Machine Learning You Must Know in 2026
Best Machine Learning Courses for Finance You Must Know
Best Resources to Learn Machine Learning Online in 2026
Thank YOU!
Though of the Day…
‘ Anyone who stops learning is old, whether at twenty or eighty. Anyone who keeps learning stays young.
– Henry Ford

Written By Aqsa Zafar
Aqsa Zafar is a Ph.D. scholar in Machine Learning at Dayananda Sagar University, specializing in Natural Language Processing and Deep Learning. She has published research in AI applications for mental health and actively shares insights on data science, machine learning, and generative AI through MLTUT. With a strong background in computer science (B.Tech and M.Tech), Aqsa combines academic expertise with practical experience to help learners and professionals understand and apply AI in real-world scenarios.