

Do you wanna know What is Principal Component Analysis?. If yes, then this blog is just for you. Here I will discuss What is Principal Component Analysis, its purpose, and How PCA works?. So, give your few minutes to this article in order to get all the details regarding Principal Component Analysis.
Hello, & Welcome!
In this blog, I am gonna tell you-
What is Principal Component Analysis?
Principal Component Analysis(PCA) is one of the best-unsupervised algorithms. Also, it is the most popular dimensionality Reduction Algorithm.
PCA is used in various Operations. Such as-
- Noise Filtering.
- Visualization.
- Feature Extraction.
- Stock Market Prediction.
- Gene Data Analysis.
The goal of PCA is to identify and detect the correlation between attributes. If there is a strong correlation and it is found. Then PCA reduces the dimensionality.
The main working of PCA is-
The Principal Component Analysis reduces the dimensions of a d-dimensional dataset by projecting it onto a k-dimensional subspace (where k<d).
Confused?
Don’t worry.
You will understand this definition at the end of this article. I will explain with the help of an example.
Now, let’s see the main purpose of PCA.
What is the main Purpose of Principal Component Analysis?
The first question is What is the need or purpose of Principal Component Analysis.
or
In which problem, The principal component analysis is used?
So the problem is Overfitting. PCA is used for the Overfitting problem.
Overfitting is the problem when you supply extra data at the training phase. When we train the model, we supply data to the model. This data is known as Training Data.
But, If we supply extra data, then the overfitting problem occurs.
In simple words, you can consider overfitting as overeating. When you eat extra food, you face digestive problems. LOL.
Similarly, the same problem occurs in overfitting. When you supply extra data, you will face a problem.
I hope, now you better understand Overfitting. Right?
Now, let’s see how the PCA solves overfitting problems.
Suppose after the training phase, this hypothesis is generated.
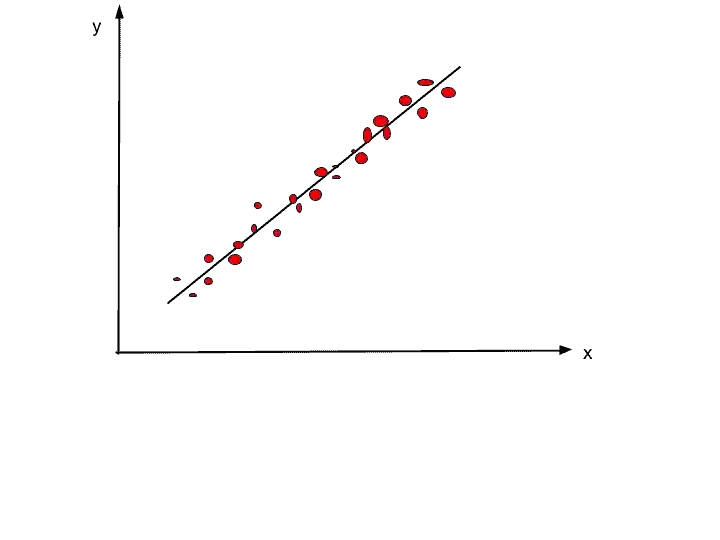
So, What this hypothesis or model is doing?
This model is trying to reach at each point. The single straight line is trying to touch each point. And that’s the overfitting problem.
So to solve this problem. PCA tries to convert high dimensionality into the set of low dimensionality.
PCA reduces the features and attributes into a low dimension, in order to solve overfitting.
And that’s the main motive or purpose of PCA.
Now, let’s see how PCA works?
How Principal Component Analysis work?
In the previous section, you understand the whole concept of Overfitting.
Assume we have given data in such a format for the training phase. It is just for your reference. Ok.
| Age | Salary |
|---|---|
| 40 | 20 LPA |
| 25 | 8 LPA |
| 35 | 15 LPA |
The data has only two attributes the Age, and salary. We train our model on these two attributes. And after training, we get this hypothesis.
One attribute is on the x-axis, and the second one is on the y-axis.
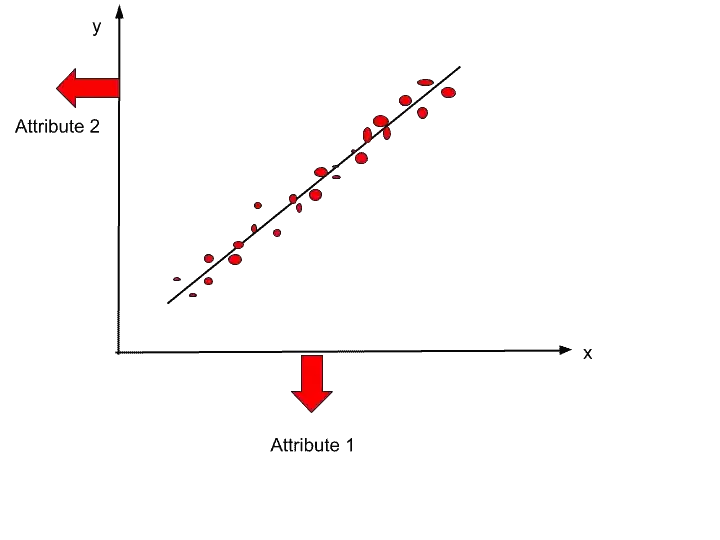
Here, we found that our model is facing the overfitting problem. So to solve overfitting we use principal component analysis.
And for that work, we need to find a PC (Principal Components).
So, the next question is-
How to find PCs?
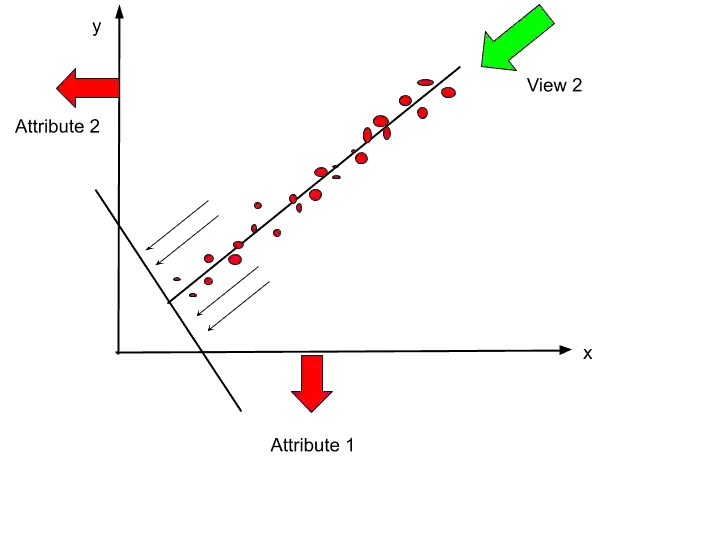
To find PCs, there is another term used, and that is Views.
Views are nothing but different angles from where you saw your data or hypothesis.
Suppose you saw your hypothesis from the top level, so how it looks?.
Let’ see in the below image.
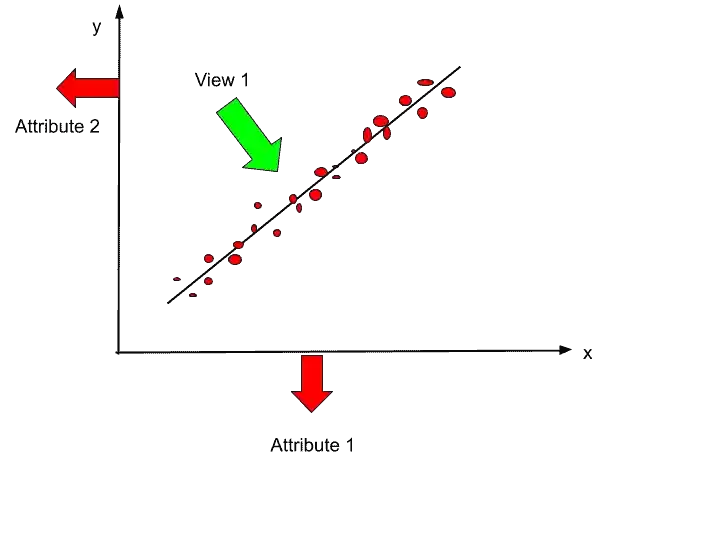
If I see my data points from that point, so I will see one line. And on that line, there will be some points mapped on that line. Just see in the image below.

So what we have done here?.
Before we have two dimensions x and y. And now we have only one. So basically we reduce from two-dimension to one-dimension.
As I discussed the definition of PCA in the first section, that PCA reduces d-dimensional dataset into a k-dimensional subspace.
So, here d-dimensional dataset is the two-dimensional dataset- age, and salary. And PCA reduced it into a k-dimensional subspace that is a one-dimensional single line.
I hope, now you understand what PCA does.
In other words, we have reduced dimensionality.
You can call it PC1. Similarly, we can find more PCs by looking at different angles or views.
Let’s see how to generate the Second PC?
If I see the hypothesis from that view, then let’s see how it will look.
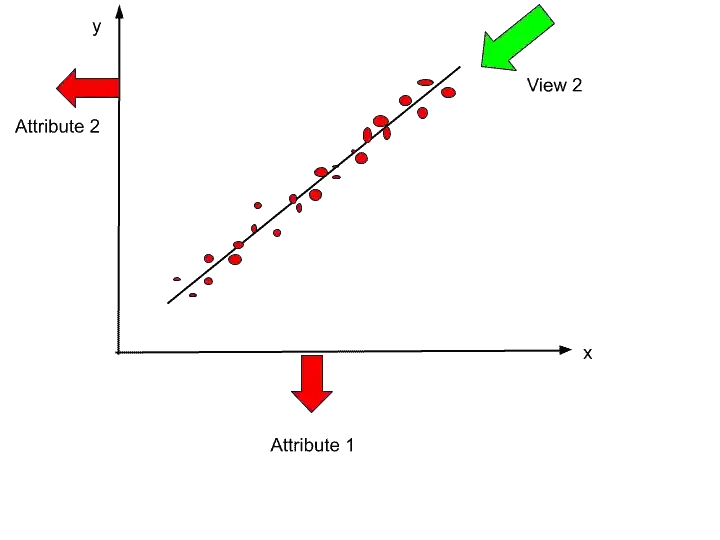
So from that view How it will look?.
Are you thinking that only one point will be seen?
If yes, then sorry you are thinking wrong. You will not see only a single dot point.
Now, you have a question Why we will not see only one point?
So to understand, we need to go in little more detail.
We can imagine one line horizontal to this straight line, and all these points will be mapped on that line.
Confused?
Don’t worry. Just look at this image, and then you will understand.
Now I hope you understand what I was saying.
Right?.
So, now when we plot this line, and all these points will be mapped on that line. So how it will look?.
Let’s see in this image.

Very much similar to PC1. So as of now, we have generated two principal components PC1, and PC2.
The very important point you should keep in your mind is that the number of principal components can be less than or equal to the number of attributes.
That means your Principal Components (like PC1, and PC2) should be equal to or less than the attributes (in that example age, and salary).
Got it?.
Now, the next question is-
What to do when we have more than two attributes?
So in that case, we can also reduce the dimension in the same way.
Suppose we have generated 5 principal components PC1, PC2, PC3, PC4, and PC5. So whom to give more preference above 5?
The answer is PC1.
Always give preference to PC1 of any model. Then PC2, and so on.
Suppose in this example, we have generated two Principal Components PC1 and PC2. But we will give preference to PC1.
There is one more Property. And that is the Orthogonal Property.
So, What is Orthogonal Property?
There should be orthogonal property between PC1 and PC2. That means both PC1 and PC2 should be independent with each other. No one should be dependent on each other.
In simple words, PC1 should not dependent upon PC2 and vise versa.
All Principal Component should be totally independent.
Conclusion
In short, PCA is the most powerful and popular dimensionality reduction algorithm.
So, that’s all about the intuition behind Principal Component Analysis. I hope now you have a better understanding of PCA.
If you have any doubt, feel free to ask me in the comment section.
Enjoy Machine Learning
All the Best!
Wanna Learn Basics of ML?. Learn here.
Are you ML Beginner and confused, from where to start ML, then read my BLOG – How do I learn Machine Learning?
If you are looking for Machine Learning Algorithms, then read my Blog – Top 5 Machine Learning Algorithm.
If you are wondering about Machine Learning, read this Blog- What is Machine Learning?
Thank YOU!
Though of the Day…
‘ Anyone who stops learning is old, whether at twenty or eighty. Anyone who keeps learning stays young.
– Henry Ford

Written By Aqsa Zafar
Aqsa Zafar is a Ph.D. scholar in Machine Learning at Dayananda Sagar University, specializing in Natural Language Processing and Deep Learning. She has published research in AI applications for mental health and actively shares insights on data science, machine learning, and generative AI through MLTUT. With a strong background in computer science (B.Tech and M.Tech), Aqsa combines academic expertise with practical experience to help learners and professionals understand and apply AI in real-world scenarios.