
Are you confused and wanna know What is the Confusion Matrix in Machine Learning?. If yes, then read this full article. Now Confusion Matrix will not confuse you anymore!. I tried to explain the Confusion Matrix in a very easy way. I hope your all confusions related to the Confusion Matrix will clear after reading this article.
So, without further ado, let’s get started-
What is the Confusion Matrix in Machine Learning?
Definition of Confusion Matrix- The Confusion Matrix is a way to find how many predicted categories or classes were correctly predicted and how many were not.
Confused?
Now, let me explain from very basics, so that you understand Confusion Matrix easily.
Suppose this is our Medical Dataset, where some symptoms of Covid-19 are given, and the model has to predict whether a patient is Corona Positive or not-
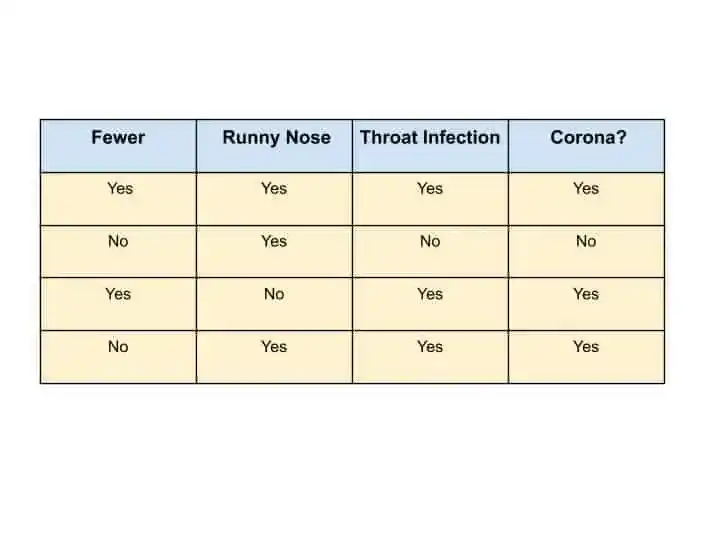
So to perform this prediction, we can use any machine learning algorithms. But which algorithm gives more accurate results?.
This is the biggest question!
So, to find out which machine learning algorithms predict well, we use Confusion Matrix. I hope now you understood the use of the Confusion Matrix.
But the next question is- how to use Confusion Matrix to find out which Machine learning algorithm predicts well?.
Right?
So, let’s understand the working of Confusion Matrix with the help of an example-
How to Draw a Confusion Matrix?
Suppose we train and test our model with the Random Forest Algorithm and K- Nearest Neighbors Algorithm. And we have to find out which algorithms predict well.
After training and testing of the dataset with both algorithms, we summarize how each algorithm performs. And for that, we use the Confusion Matrix.
This is our blank Confusion Matrix for Covid-19 dataset-
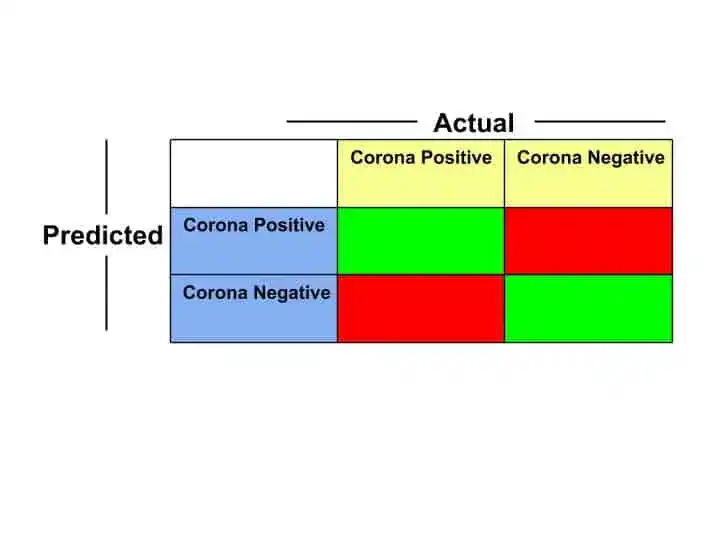
The rows in a confusion matrix correspond to predicted values. Predicted values are the values that machine learning algorithms predict.
The columns in a confusion matrix correspond to Actual values. Actual values are the values that we already have in the dataset.
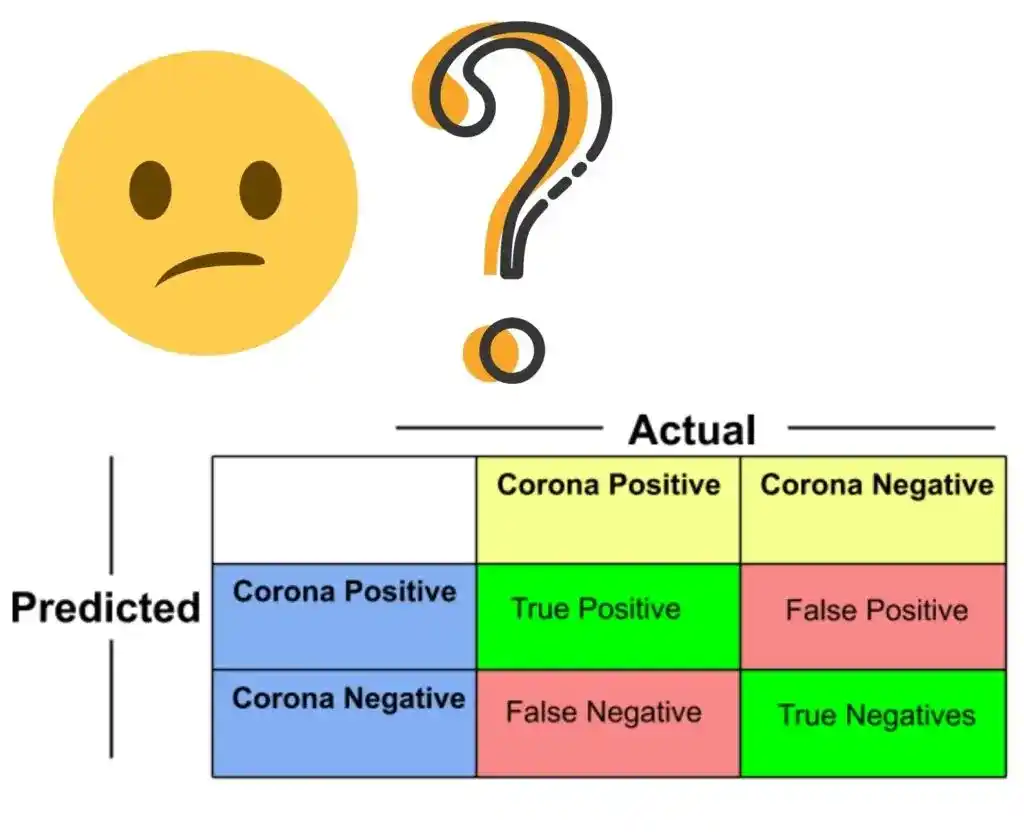
The four blank boxes are known as-
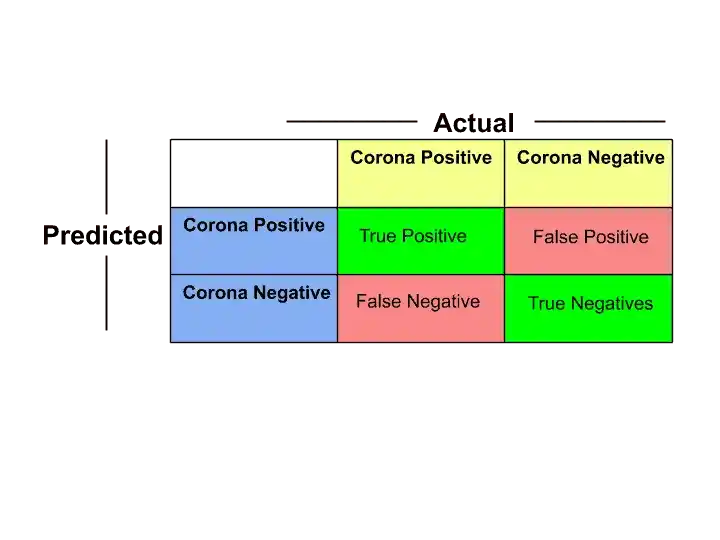
1. True Positive-
The patient is Corona Positive in actual and the model also predicts Corona Positive. But Why it is called True Positive?–
- Because Actual and Predicted both values are matched that’s why it’s True. And both actual and model have Yes or Positive that’s why it’s Positive. So it’s True Positive.
2. True Negative-
The patient is Corona Negative in actual and the model also predicts Corona Negative. But Why it is called True Negative?–
- True because both actual and predicted values matched. And Negative because both actual and predicted values are No or Negative. So it’s True Negative.
3. False Positive-
The patient is Corona Negative in actual but model predicts Corona Positive. But Why it is called False Positive?
- False because actual and predicted values don’t match. And Positive because Model predicts as Positive or Yes. So it’s False Positive.
False Positive is also known as Type-1 Error.
4. False Negative-
The patient is Corona Positive in actual but model Predict as Corona Negative. But Why it is called False Negative?
- False because actual and predicted values don’t match again. And Negative because the model predicts as Negative or No. So it’s False Negative.
False Negative is also known as Type-2 Error.
So, Suppose we get the following values after applying the Random Forest Algorithm to the Test Data–
Random Forest Algorithm Confusion Matrix

In this image, the numbers in the green boxes tell us how many times the samples were correctly classified. And the numbers in the red boxes tell us how many times the samples were not correctly classified.
And when we apply K- Nearest Neighbors Algorithm to the Testing data, suppose we get the following values-
K- Nearest Neighbors Algorithm Confusion Matrix
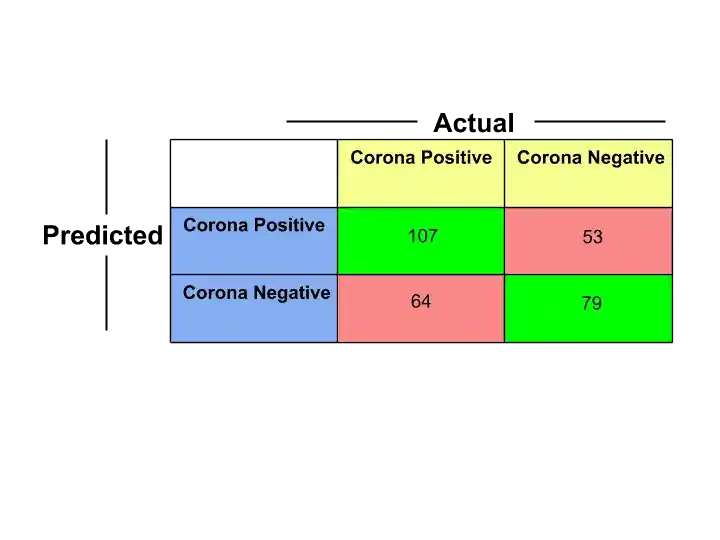
Now, its time to compare and check which algorithm predicts well. So to do this, we compare the confusion matrix of both algorithms.
And for comparison, you need to remember some formulas. These formulas are-
Accuracy-
Accuracy= True Positive+True negative/ Total
Error Rate-
Error Rate= 1- Accuracy
Or,
False Positive+False Negative/ Total
Precision-
Precision= True Positive/ Predicted Positive
Recall-
Recall= True Positive/ Actual Positive
The formulas for Precision and Recall are almost similar, the only denominator is changed. So, let’s calculate Accuracy, Error Rate, Precision, and Recall of both algorithms with the help of the confusion matrix.
So, let’s start with Random Forest Algorithm-
Final Confusion Matrix of Random Forest Algorithm-
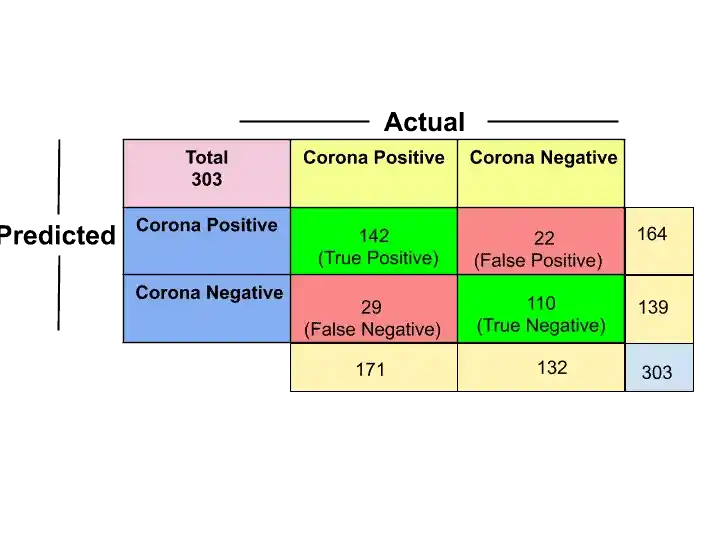
In this image, the numbers in the yellow boxes are the sum of corresponding rows and columns. Suppose 171 came after adding 142+29.
So, let’s calculate Accuracy, Error Rate, Precision, and Recall–
Accuracy= True Positive+True negative/ Total
=142+110/303
=252/303
=0.83
Error Rate= 1- Accuracy
=0.17
Precision= True Positive/ Predicted Positive
=142/164
How 164?
142+22=164 (see image)
=0.86
Recall= True Positive/ Actual Positive
=142/171
How 171?
142+29= 171 (see image)
=0.83
Now let’s calculate Accuracy, Error Rate, Precision, and Recall of K- Nearest Neighbors Algorithm–
Final Confusion Matrix of K- Nearest Neighbors Algorithm–

Accuracy= True Positive+True negative/ Total
= 186/303
=0.61
Error Rate= 1- Accuracy
=0.39
Precision= True Positive/ Predicted Positive
=107/160
=0.66
Recall= True Positive/ Actual Positive
=107/171
=0.62
And here we go!. We have calculated Accuracy, Error Rate, Precision, and Recall for both algorithms. And it is very clear from these values that the Random Forest Algorithm predicts well as compare to the K- Nearest Neighbors Algorithm.
Why?
Because the Random Forest Algorithm has high accuracy, precision, and recall as compared to K- Nearest Neighbors Algorithm. Random Forest Algorithm has a low error rate as compared to K- Nearest Neighbors Algorithm.
I hope now you are not confused with Confusion Matrix. Now it’s time to wrap up.
Conclusion
I tried to write this article in a super-easy way so that your all confusion get clear. I hope you understood the whole concept of the Confusion Matrix. But still, if you have some doubt, feel free to ask me in the comment section.
All the Best!
Happy Learning!
Learn the Basics of Machine Learning Here
Related Search
9 Best Tensorflow Courses & Certifications Online- Discover the Best One!
Machine Learning Engineer Career Path: Step by Step Complete Guide
Best Online Courses On Machine Learning You Must Know in 2026
What is Machine Learning? Clear your all doubts easily.
K Fold Cross-Validation in Machine Learning? How does K Fold Work?
What is Principal Component Analysis in ML? Complete Guide!
Linear Discriminant Analysis Python: Complete and Easy Guide
Types of Machine Learning, You Should Know
Multi-Armed Bandit Problem- Quick and Super Easy Explanation!
Upper Confidence Bound Reinforcement Learning- Super Easy Guide
Top 5 Robust Machine Learning Algorithms
Support Vector Machine(SVM)
Decision Tree Classification
Random Forest Classification
K-Means Clustering
Hierarchical Clustering
ML vs AI vs Data Science vs Deep Learning
Increase Your Earnings by Top 4 ML Jobs
How do I learn Machine Learning?
Multiple Linear Regression: Everything You Need to Know About
Thank YOU!
Though of the Day…
‘ Anyone who stops learning is old, whether at twenty or eighty. Anyone who keeps learning stays young.
– Henry Ford

Written By Aqsa Zafar
Aqsa Zafar is a Ph.D. scholar in Machine Learning at Dayananda Sagar University, specializing in Natural Language Processing and Deep Learning. She has published research in AI applications for mental health and actively shares insights on data science, machine learning, and generative AI through MLTUT. With a strong background in computer science (B.Tech and M.Tech), Aqsa combines academic expertise with practical experience to help learners and professionals understand and apply AI in real-world scenarios.
Thank you for your great post! I enjoyed it. Also, I want to note something about the Precision and Recall formula. You wrote “Precision= TP/ Predicted Positive” and “Recall= TP/ Actual Positive”, and it’s correct, however, we can also write them as “Precision= TP / (TP / FP)” and for recall, we can write “Recall = TP / (TP / FN)”. Actually, your formulation is more intuitive and I just mentioned this alternative formulation, because we maybe see this type of formulation in other sites or articles.
Hi Masoud,
Thanks for your feedback!
Yes we can also write Precision= TP / (TP + FP)
& Recall = TP / (TP + FN)
That’s why I have mentioned in the calculation How I calculated Predicted Positive.
Predictive Positive is nothing but TP+FP
And Actual Positive is = TP+ FN