
In this article, I am gonna share how to build Wine Recommender System by Using the popular dimensionality reduction technique, Principal Component Analysis. So give your few minutes and learn how you can build a Wine Recommender System.
So, without further ado, let’s get started-
Wine Recommender System Using Principal Component Analysis
Before moving to the implementation part, I would like to tell you about the Dataset, Problem Statement, and some basic concepts of PCA(Principal Component Analysis).
Dataset
This is our dataset-
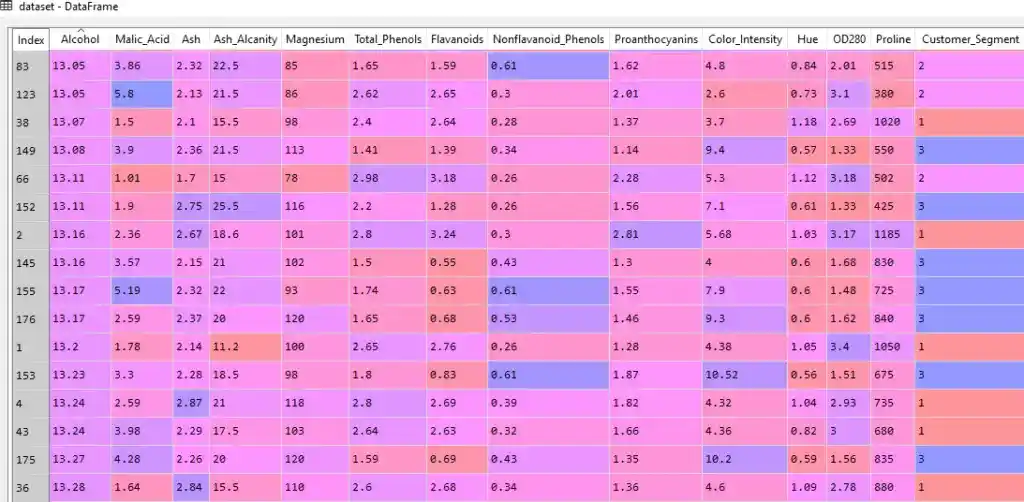
This dataset has 13 features from Alcohol to Proline. Each feature is giving some information related to a certain wine. Each row corresponds to wine, and each wine has different features like Alcohol level, the malic acid level, etc. So these are different wine characteristics given.
The last column, “Customer_Segment” represents different segments of wine. As you can see there are three segments 1, 2, and 3.
This dataset belongs to UCI Machine Learning Repository. You can download the dataset from Kaggle.
Problem Statement
Suppose this dataset belongs to a Wine Merchant, who has different bottles of wine to sell and has a large base of customers. And the wine merchant hires you as a data scientist and wants you to reduce the complexity of this dataset. And the owner would also want you to build a predictive model, trained on this data including the dependent variable column- “Customer_Segment“.
The objective of this problem is to, identify which customer segment each wine belongs to. So that you can recommend the wine to the right customer. In a nutshell, you have to build a Wine Recommender system.
This Recommender system will optimize the sale and increase the profit of Wine Shop.
I hope now you understood the dataset and the problem statement. Now let’s understand some basics of PCA(Principal Component Analysis).
What is PCA(Principal Component Analysis)?
The goal of PCA is to identify and detect the correlation between attributes. If there is a strong correlation and it is found. Then PCA reduces the dimensionality.
So, PCA does this job-
The Principal Component Analysis reduces the dimensions of a d-dimensional dataset by projecting it onto a k-dimensional subspace (where k<d).
I am not going to discuss how PCA works. I have already discussed the working of PCA in super easy terms. If you want to learn how PCA reduces the dimensionality, then check out this article- What is Principal Component Analysis in Machine Learning? Complete Guide!
Now, it’s time to implement something interesting. So, let’s get started-
Wine Recommender System Using PCA
So, the first step is-
1. Import the Libraries
import numpy as np
import matplotlib.pyplot as plt
import pandas as pd
NumPy is an open-source Python library used to perform various mathematical and scientific tasks. NumPy is used for working with arrays. It also has functions for working in the domain of linear algebra, Fourier transform, and matrices.
Matplotlib is a plotting library, that is used for creating a figure, plotting area in a figure, plots some lines in a plotting area, decorates the plot with labels, etc.
Pandas is a tool used for data wrangling and analysis.
So in step 1, we imported all required libraries. Now the next step is-
2. Load the Dataset
dataset = pd.read_csv('Wine.csv')So, when you load the dataset after running this line of code, you will get your data something like this-
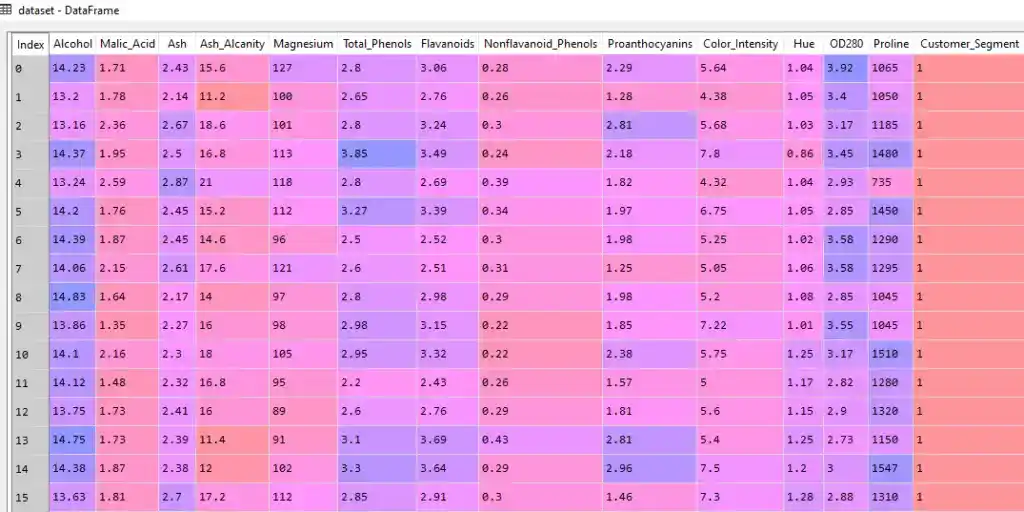
As you can see in the dataset, there are 13 independent variables and one dependent variable present. But we have to separate independent variables and dependent variables.
So for this, we perform our next step-
3. Split Dataset into X and Y
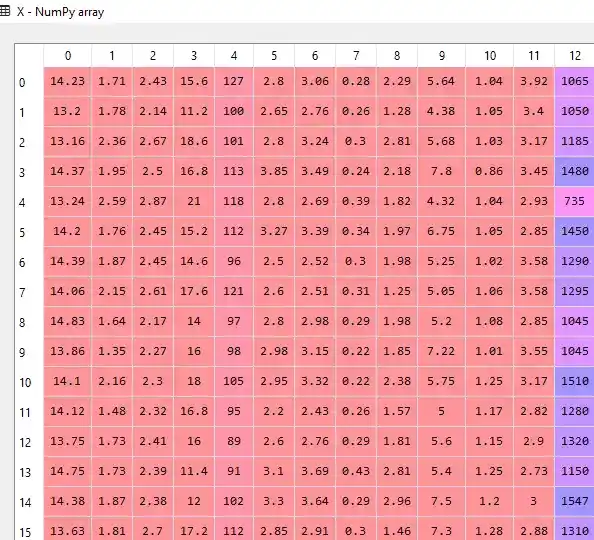
X = dataset.iloc[:, 0:13].values
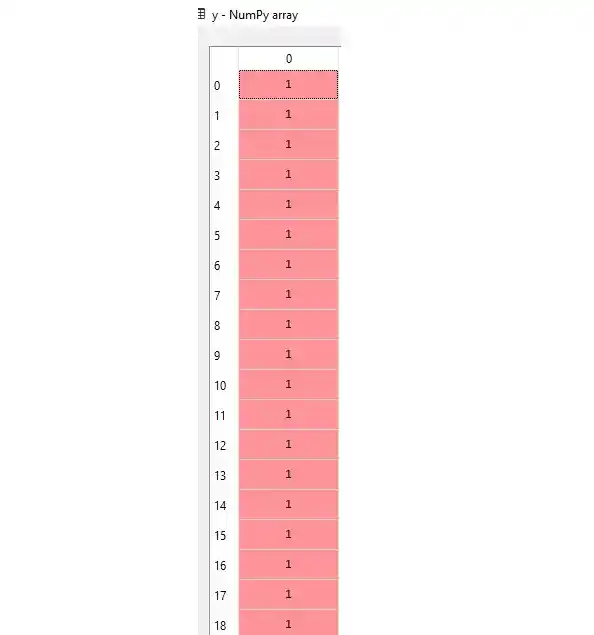
y = dataset.iloc[:, 13].valuesWhen you run these lines, you get two separate tables X and Y. Something like this-
Independent Variables (X)-
Dependent Variable(Y)–
Now we have divided our dataset into X and Y. So the next step is-
4. Split the X and Y Dataset into the Training set and Test set
For building a machine learning model, we need to train our model on the training set. And for checking the performance of our model, we use a Test set. That’s why we have to split the X and Y dataset into the Training set and Test set.
from sklearn.model_selection import train_test_split
X_train, X_test, y_train, y_test = train_test_split(X, y, test_size = 0.2, random_state = 0)
While splitting into training and test set, you have to remember that, 80%-90% of your data should be in the training tests. And that’s why I write test_size = 0.2.
I hope now you understood.
So, when you run these lines, you get 4 different tables- X_train, X_test, y-train, and y_test.
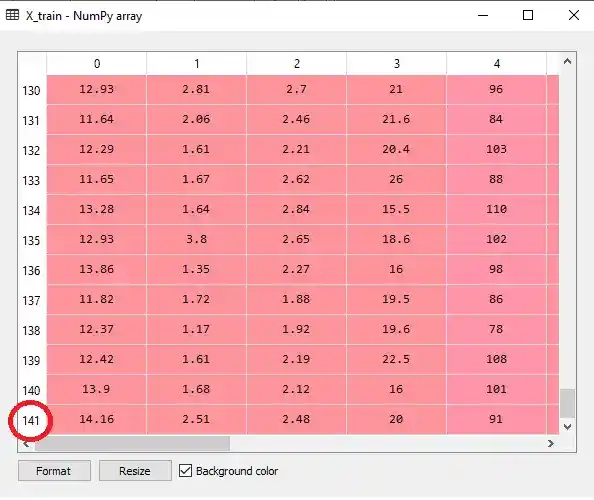
As you can see here, in X_train we have 141 rows-
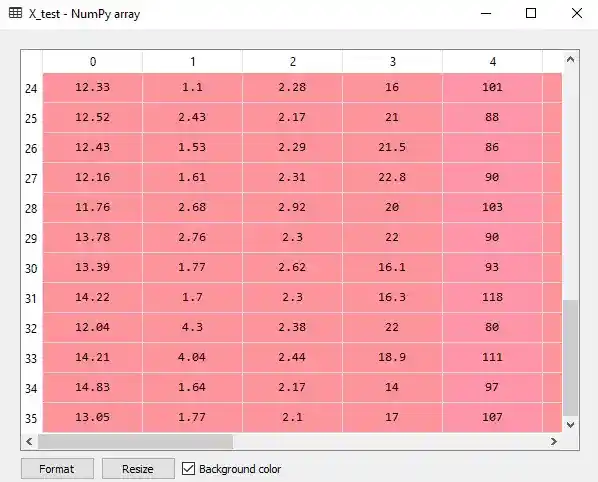
And in X_test, we have only 35 rows-
Now, we have splitted our dataset into X_train, X_test, y-train, and y_test. The next step is-
Perform Feature Scaling
As you can see in the dataset, all values are not in the same range. And that requires a lot of time for calculation. So to overcome this problem, we perform feature scaling.
Feature scaling help us to normalize the data within a particular range.
from sklearn.preprocessing import StandardScaler
sc = StandardScaler()
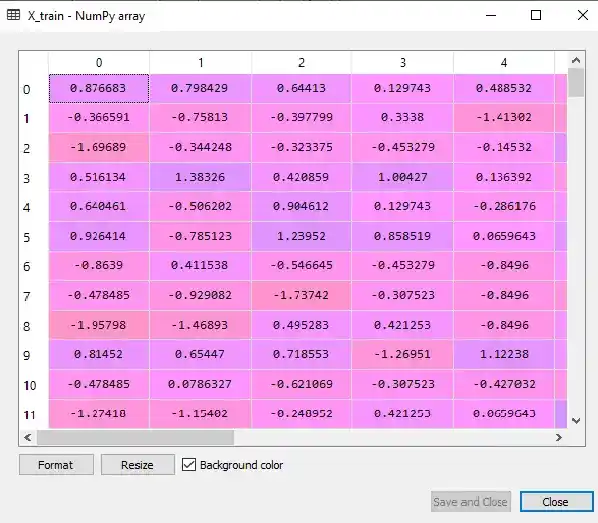
X_train = sc.fit_transform(X_train)
X_test = sc.transform(X_test)After performing feature scaling, all values are normalized and looks something like this-
Now, we are done with data preprocessing steps. It’s time to apply PCA to our dataset-
5. Apply PCA
from sklearn.decomposition import PCA
pca = PCA(n_components = 2)
X_train = pca.fit_transform(X_train)
X_test = pca.transform(X_test)
n_components is the number of extracted features or principal components. You can change this number based on the results. So let’s test n_components as 2. If we will get good results, then we will keep it up, otherwise, we will change and check the performance of our model.
We apply PCA to our training set as well as the test set. But did you notice, I didn’t write the fit_transform method in X_test?
Do you know why…?
Because to avoid information leakage on the test set. The test set should be new observations, on which we test our model performance. If we perform fit_transform on X_test, that means we are giving some hints to the test set.
I hope you understood the reason.
So after applying PCA, the next step is-
6. Fit Logistic Regression to the Training set
I am going to use Logistic Regression, but you can use any other classification algorithms. It’s up to you. Even for practice, just try to use other classification algorithms and compare the accuracies of different algorithms.
Always make sure, that you have to apply PCA before fitting any machine learning algorithm. Why…? Because we train our model on the low dimension dataset. That’s why I applied PCA first.
So, let’s fit logistic regression to the training set-
from sklearn.linear_model import LogisticRegression
classifier = LogisticRegression(random_state = 0)
classifier.fit(X_train, y_train)
Now all done. It’s time to predict the Test set. So the next step is-
7. Predict the Test Set Results
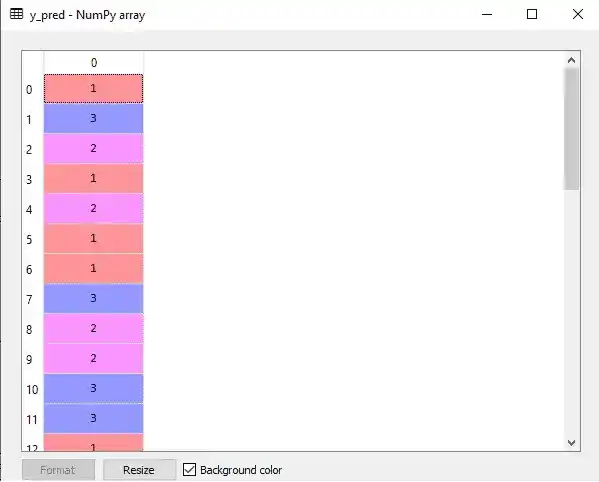
y_pred = classifier.predict(X_test)When you run this line of code, you will get y_pred, something like this-
But can you explain by looking at these predicted values, how much values are predicted right, and how much values are predicted wrong?
For a small dataset, you can. But when we have a large dataset, it’s quite impossible. And that’s why we use a confusion matrix, to clear our confusion.
So, the next step is-
8. Make the Confusion Matrix
from sklearn.metrics import confusion_matrix, accuracy_score
cm = confusion_matrix(y_test, y_pred)
print(cm)
accuracy_score(y_test,y_pred)
So, when you run these lines of code, you get confusion matrix, that looks something like this-
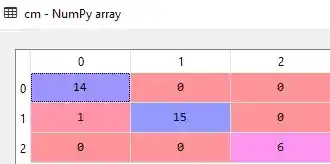
Here we got confusion matrix of 3 rows and 3 columns, because we have 3 classes or customer_segments.
Our model does only one wrong prediction. And that’s why our model accuracy is 0.9722222222222222 (97%). Amazing…Right?.
Now it’s time to showcase our findings in a visual form. So the next step is-
9. Visualise the Test set results
from matplotlib.colors import ListedColormap
X_set, y_set = X_test, y_test
X1, X2 = np.meshgrid(np.arange(start = X_set[:, 0].min() - 1, stop = X_set[:, 0].max() + 1, step = 0.01),
                     np.arange(start = X_set[:, 1].min() - 1, stop = X_set[:, 1].max() + 1, step = 0.01))
plt.contourf(X1, X2, classifier.predict(np.array([X1.ravel(), X2.ravel()]).T).reshape(X1.shape),
             alpha = 0.75, cmap = ListedColormap(('red', 'green', 'blue')))
plt.xlim(X1.min(), X1.max())
plt.ylim(X2.min(), X2.max())
for i, j in enumerate(np.unique(y_set)):
    plt.scatter(X_set[y_set == j, 0], X_set[y_set == j, 1],
                c = ListedColormap(('red', 'green', 'blue'))(i), label = j)
plt.title('Logistic Regression (Test set)')
plt.xlabel('PC1')
plt.ylabel('PC2')
plt.legend()
plt.show()
So, after running this code, you will get your visual results-
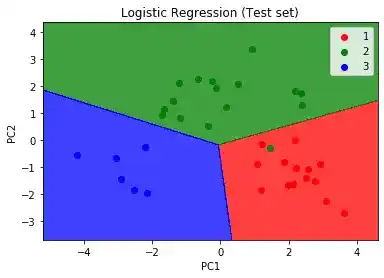
As you can see, there is only one incorrect prediction. The green dot showing in the red region. This is a great prediction.
And here we go…Congratulation! You have build your Wine Recommender System Using Principal Component Analysis with 97% accuracy.
Conclusion
I tried to explain the whole procedure of the Wine Recommender System Using Principal Component Analysis in an easy way. Hope you understood.
I would suggest you try it yourself. For practice, you can select different classification algorithms instead of logistic regression, and let me know what accuracy you are getting.
If you have any doubts, feel free to ask me in the comment section. I would like to help you.
Happy Learning!
Similar Searches
Best Math Courses for Machine Learning- Find the Best One!
9 Best Tensorflow Courses & Certifications Online- Discover the Best One!
Machine Learning Engineer Career Path: Step by Step Complete Guide
Best Online Courses On Machine Learning You Must Know in 2026
Best Machine Learning Courses for Finance You Must Know
What is Machine Learning? Clear your all doubts easily.
K Fold Cross-Validation in Machine Learning? How does K Fold Work?
What is Principal Component Analysis in ML? Complete Guide!
Linear Discriminant Analysis Python: Complete and Easy Guide
Types of Machine Learning, You Should Know
Multi-Armed Bandit Problem- Quick and Super Easy Explanation!
Upper Confidence Bound Reinforcement Learning- Super Easy Guide
Top 5 Robust Machine Learning Algorithms
Support Vector Machine(SVM)
Decision Tree Classification
Random Forest Classification
K-Means Clustering
Hierarchical Clustering
ML vs AI vs Data Science vs Deep Learning
Increase Your Earnings by Top 4 ML Jobs
How do I learn Machine Learning?
Multiple Linear Regression: Everything You Need to Know About
Thank YOU!
Though of the Day…
‘ Anyone who stops learning is old, whether at twenty or eighty. Anyone who keeps learning stays young.
– Henry Ford

Written By Aqsa Zafar
Aqsa Zafar is a Ph.D. scholar in Machine Learning at Dayananda Sagar University, specializing in Natural Language Processing and Deep Learning. She has published research in AI applications for mental health and actively shares insights on data science, machine learning, and generative AI through MLTUT. With a strong background in computer science (B.Tech and M.Tech), Aqsa combines academic expertise with practical experience to help learners and professionals understand and apply AI in real-world scenarios.